Friday, 28 June 2013

District Run-Down (3 of 6) - Victoria

Now we flick across the country to Victoria, as I provide my opinion of the baseline nature of each seat. It resembles how the seats might fall in a 50-50 split of the primary vote -- which is far closer to recent polling now that we have a new PM.

      June 15th: South Australia (X)
      June 22nd: Western Australia (X)
June 29th: Victoria
July 6th: Queensland 
July 13th: New South Wales
July 20th: Tasmania, Northern Territory and Australian Capital Territory
And so:

Victoria:

The Quaternary sector, including finance and insurance, is the most profitable in the state, although the largest employer is the troubled secondary (manufacturing) sector. Victoria also has a high unemployment rate. (source). The state government, as with most states, is bicameral and based on the Westminster system.

The lower house (Legeslative Assembly) is currently held by the Coalition, with 34 Liberal MPs and 10 Nationals, just outnumbering the 43 ALP members. There is one Independent as of March this year, when Geoff Shaw resigned from the Liberal Party. The seats of the upper house (Legislative Council) are held by 18 Liberal councillors, 16 Labor councillors and three each from the Nationals and the Greens.

The state contains 37 federal electoral districts, and as a state elects 6 Senators to the Federal Parliament.

How to Read These Summaries:


Incumbent: Incumbent lists the current member for the seat and their current party.
Incumbent/Party Run: Incumbent run provides the number of elections won by the current member, and the years of those elections in parentheses. By-elections are ignored.
A second line may be present and indicate the number of elections won by the current member's party, if this is different to the number won by the current member. Again the years of those elections in parentheses, and again by-elections are ignored.
2010 Margin (TPP): This is the margin by which the seat was won after the last redistribution of preferences in the 2010 federal election, and who this margin was against.
Electoral History: A list of previous incumbent parties from the foundation of the seat to the present.
Longest Electoral Run: The most elections won in a row in this seat by one party, with the years of those elections in parentheses and the party which won the seat in those elections.
State Divisions: The state seats within this federal seat. The seat names are coloured according to their current incumbent (blue for Liberal, red for ALP, dark yellow for Nationals and grey for Independents). The last state election was in 2010.
Assessment: An assessment of the seats political history - that is, whether the seat is traditionally of one party or another. This is only approximated from the data here, does not constitute a prediction and may differ from the current incumbent's party.

Aston:

Incumbent: Alan Tudge (LIB)
Incumbent/Party Run: 1 Elections won (2010 - Present)
8 Elections won (1990 - Present)
2010 Margin (TPP): 1.76% against ALP
Electoral History: 1984–1990: ALP
1990–present: LIB
Longest Electoral Run:  8 Elections won (1990 - Present)  - LIB
State Divisions: Part of Bayswater, part of Ferntree Gully, part of Forest Hill, part of Mitcham and part of Scoresby.
Assessment: Stable safe LIB

Ballarat:

Incumbent: Catherine King (ALP)
Incumbent/Party Run: 4 Elections won (2001 - Present)
2010 Margin (TPP): 11.70% against LIB
Electoral History: 1901–1909: Protectionist Party
1909–1913: Commonwealth Liberal Party*
1913–1919: ALP
1919–1920: Nationalist Party
1920–1931: ALP
1931–1937: United Australia Party
1937–1949: ALP
1949–1951: LIB
1951–1955: ALP
1955–1980: LIB
1980–1990: ALP
1990–2001: LIB
2001–present: ALP
Longest Electoral Run:  10 Elections won (1955 - 1980) - LIB
State Divisions: Part of Ballarat West, part of Ballarat East, part of Melton and part of Ripon.
Assessment: Variable, safe ALP

Batman:

Incumbent: Martin Ferguson (ALP)
Incumbent/Party Run: 6 Elections won (1996 - Present)
17 Elections won (1969 - Present)
2010 Margin (TPP): 7.86% against GRN
Electoral History: 1906–1909: Protectionist Party
1909–1910: Commonwealth Liberal Party*
1910–1931: ALP
1931–1934: United Australia Party
1934–1966: ALP
1966–1969: IND
1969–present: ALP
Longest Electoral Run:  17 Elections won (1969 - present) - ALP
Including former Labor turned Independent Sam Benson (1966-1969) 30 Elections won (1934 - present) - ALP
State Divisions: Part of Bundoora, part of Northcote, Preston and part of Thomastown
Assessment: Stable, very safe ALP

Bendigo:

Incumbent: Steve Gibbons (ALP)
Incumbent/Party Run: 4 Elections won (2001 - Present)
2010 Margin (TPP): 5.93% against LIB
Electoral History: 1901–1906: Protectionist Party
1906–1909: IND Protectionist Party**
1909–1913: Commonwealth Liberal Party*
1913–1917: ALP
1917–1929: Nationalist Party
1929–1931: ALP
1931–1937: United Australia Party
1937–1949: Country Party
1949–1972: ALP
1972–1983: LIB
1983–1990: ALP
1990–1998: LIB
1998–present: ALP
Longest Electoral Run:  9 Elections won (1949–1972) - ALP
State Divisions: Part of Ballarat East, part of Bendigo East, part of Bendigo West, part of Macedon, part of Ripon and part of Rodney.
Assessment: Variable, leaning ALP

Bruce:

Incumbent: Alan Griffin (ALP)
Incumbent/Party Run: 5 Elections won (1996 - Present)
2010 Margin (TPP): 8.12% against LIB
Electoral History: 1955–1996: LIB
1996–present: ALP
Longest Electoral Run:  16 Elections won (1955–1996) - LIB
State Divisions: Part of Clayton, part of Dandenong, part of Forest Hill, part of Mount Waverly, Mulgrave and part of Scoresby.
Assessment: Variable, leaning ALP

Calwell:

Incumbent: Maria Vamvakinou (ALP)
Incumbent/Party Run: 4 Elections won (2001 - Present)
10 Elections won (1984- Present)
2010 Margin (TPP): 19.72% against LIB
Electoral History: 1984–present: ALP
Longest Electoral Run: 10 Elections won (1984- Present) - ALP
State Divisions: Part of Broadmeadows, part of Macedon and Yuroke.
Assessment: Stable, very safe ALP

Casey:

Incumbent: Tony Smith (LIB)
Incumbent/Party Run: 4 Elections won (2001 - Present)
10 Elections won (1984 - Present)
2010 Margin (TPP): 1.48% against ALP
Electoral History: 1969–1972: LIB
1972–1975: ALP
1975–1983: LIB
1983–1984: ALP
1984–present: LIB
Longest Electoral Run:  10 Elections won (1984 - Present)  - LIB
State Divisions: Part of Evelyn, part of Gembrook, part of Kilsyth, part of Monbulk and part of Warrandyte.
Assessment: Stable, leaning LIB

Chisholm:

Incumbent: Anna Burke (ALP)
Incumbent/Party Run: 5 Elections won (1998 - Present)
2010 Margin (TPP): 6.11% against LIB
Electoral History: 1949–1983: LIB
1983–1987: ALP
1987–1998: LIB
1998–present: ALP
Longest Electoral Run:  14 Elections won (1949 - 1983) - LIB
State Divisions: Part of Box Hill, part of Burwood, part of Clayton, part of Mount Waverley and part of Oakleigh.
Assessment: Variable, leaning ALP

Corangamite:

Incumbent: Darren Cheeseman (ALP)
Incumbent/Party Run: 2 Elections won (2007 - Present)
2010 Margin (TPP): 0.41% against LIB
Electoral History: 1901–1903: Protectionist Party
1903–1906: Free Trade Party
1906-1909: Anti-Socialist Party
1909–1910: Commonwealth Liberal Party*
1910–1913: ALP
1913–1917: Commonwealth Liberal Party*
1917–1918: Nationalist Party
1918–1929: Country Party
1929–1931: ALP
1931–1934: Country Party
1934–1944: United Australia Party
1944–2007: LIB
2007–present: ALP
Longest Electoral Run:  24 Elections won (1944 - 2007) - LIB
Including the preceding UAP, 28 Elections won (1934 - 2007) - UAP/LIB
State Divisions: Part of Ballarat East, part of Bellarine, part of Geelong, part of Polwarth, part of Rippon and South Barwon,.
Assessment: Stable, leaning LIB (a controversial rating, perhaps, given the pro-labor demographic of its state divisions, but it has been conservative since the 30s excluding the 2007 Rudd landslide and the last election, held by less than half of one percent of the votes. I believe this is a reliable LIB win, and that we are at the end of a small, pro-ALP statistical blip that will correct sooner rather than later.)

Corio:

Incumbent: Richard Marles (ALP)
Incumbent/Party Run: 2 Elections won (2007 - Present)
17 Elections won (1967 - Present)
2010 Margin (TPP): 14.22% against LIB
Electoral History: 1901–1909: Protectionist Party
1909–1910: Commonwealth Liberal Party*
1910–1913: ALP
1913–1914: Commonwealth Liberal Party*
1914–1917: ALP
1917–1929: Nationalist Party
1929–1931: ALP
1931–1940: United Australia Party
1940–1949: ALP
1949–1967: LIB
1967–present: ALP
Longest Electoral Run:  X Elections won 17 Elections won (1967 - Present) - ALP
State Divisions: Part of Bellarine, part of Geelong and part of Lara.
Assessment: Stable very safe ALP

Deakin:

Incumbent: Mike Symon (ALP)
Incumbent/Party Run: 2 Elections won (2007 - Present)
2010 Margin (TPP): 2.41% against LIB
Electoral History: 1937–1944: United Australia Party
1944–1983: LIB
1983–1984: ALP
1984–2007: LIB
2007–present: ALP
Longest Electoral Run: 15 Elections won (1944 - 1983) - LIB
Including the preceding United Australia Party, 18 Elections won (1937 - 1983) - LIB/UAP
State Divisions: Part of Bayswater, part of Forest Hill, part of Kilsyth, part of Mitcham and part of Warrandyte.
Assessment: Stable, very safe LIB (despite low TPP lead)

Dunkley:

Incumbent: Bruce Billson (LIB)
Incumbent/Party Run: 6 Elections won (1996 - Present)
2010 Margin (TPP): 1.02% against ALP
Electoral History: 1984–1990: ALP
1990–1993: LIB
1993–1996: ALP
1996–present: LIB
Longest Electoral Run:  6 Elections won (1996 - Present) - LIB/ALP
State Divisions: Parts of Carrum, part of Cranbourne, Frankston***, part of Hastings and part of Mornington.
Assessment: Variable, leaning LIB

Flinders:

Incumbent: Greg Hunt (LIB)
Incumbent/Party Run: 4 Elections won (2001 - Present)
10 Elections won (1984 - Present)
2010 Margin (TPP): 9.11% against ALP
Electoral History: 1901–1906: Free Trade Party
1906–1909: Anti-Socialist Party
1909–1917: Commonwealth Liberal Party*
1917–1929: Nationalist Party
1929–1931: ALP
1931–1944: United Australia Party
1944–1952: LIB
1952–1954: ALP
1954–1983: LIB
1983–1984: ALP
1984–present: LIB
Longest Electoral Run:  12 Elections won (1954–1983) - LIB
State Divisions: Part of Bass, part of Hastings, part of Mornington and Nepean.
Assessment: Stable, safe LIB

Gellibrand:

Incumbent: Nicola Roxin (ALP)
Incumbent/Party Run: 5 Elections won (1998 - Present)
25 Elections won (1949 - Present)
2010 Margin (TPP): 23.90% against LIB
Electoral History: 1949-present: ALP
Longest Electoral Run:  25 Elections won (1949 - Present) ALP
State Divisions: Part of Altona, part of Footscray and Williamstown.
Assessment: Stable, very safe ALP

Gippsland:

Incumbent: Darren Chester (NAT)
Incumbent/Party Run: 1 Elections won (2010 - Present)
11 Elections won (1982 - Present)
Including the preceding Country Party and National Country Party, 35 Elections won (1922 - Present)
2010 Margin (TPP): 1.45% against ALP
Electoral History: 1901–1904: Protectionist Party
1904–1906: Anti-Socialist Party
1906–1909: Protectionist Party
1909–1913: IND
1913–1914: Commonwealth Liberal Party*
1914–1917: IND
1917–1922: Nationalist Party
1922–1975: Country Party
1975–1982: National Country Party
1982–present: NAT:
Longest Electoral Run:  11 Elections won (1982 - Present) - NAT
Including the preceding Country Party and National Country Party, 35 Elections won (1922 - Present) - NAT/National Country Party/Country Party
State Divisions: Gippsland East, part of Gippsland South and part of Morwell.
Assessment: Stable, very safe NAT (despite low TPP lead)

Goldstein:

Incumbent: Andrew Robb (LIB)
Incumbent/Party Run: 3 Elections won (2004 - Present)
10 Elections won (1984 - Present)
2010 Margin (TPP): 6.47% against ALP
Electoral History: 1984-present: LIB
Longest Electoral Run:  10 Elections won (1984 - Present) - LIB
State Divisions: Part of Bentleigh, part of Brighton, part of Caulfield, part of Oakleigh and part of Sandringham.
Assessment: Stable, very safe LIB

Gorton:

Incumbent: Brendan O'Connor (ALP)
Incumbent/Party Run: 3 Elections won (2004 - Present)
2010 Margin (TPP): 22.16% against LIB
Electoral History: 2004-present: ALP
Longest Electoral Run:  3 Elections won (2004 - 2004) - ALP
State Divisions: Part of Derrimut, Keilor, part of Kororoit and part of Niddrie.
Assessment: Very safe ALP (insufficient data to determine stability)

Higgins:

Incumbent: Kelly O'Dwyer (LIB)
Incumbent/Party Run: 1 Elections won (2010 - Present)
25 Elections won (1949 - Present)
2010 Margin (TPP): 6.75% against ALP
Electoral History: 1949-present: LIB
Longest Electoral Run:  25 Elections won (1949 - Present) - LIB
State Divisions: Part of Burwood, part of Hawthorn, Malvern, part of Oakleigh and part of Prahran.
Assessment: Stable, very safe LIB

Holt:

Incumbent: Anthony Byrne (ALP)
Incumbent/Party Run: 4 Elections won (2001 - Present)
12 Elections won (1980 - Present)
2010 Margin (TPP): 13.23% against LIB
Electoral History: 1969–1972: LIB
1972–1975: ALP
1975–1980: LIB
1980-present: ALP
Longest Electoral Run:  12 Elections won (1980 - Present) - ALP
State Divisions: Part of Cranbourne, part of Dandenong, part of Lyndhurst, part of Narre Warren North and part of Narre Warren South.
Assessment: Stable, very safe ALP

Hotham:

Incumbent: Simon Crean (ALP)
Incumbent/Party Run: 8 Elections won (1990 - Present)
12 Elections won (1980 - Present)
2010 Margin (TPP): 13.50% against LIB
Electoral History: 1969–1980: LIB
1980–present: ALP
Longest Electoral Run:  12 Elections won (1980 - Present) - LIB
State Divisions: Part of Bentleigh, part of Brighton, part of Clayton, part of Lyndhurst, part of Mordialloc, part of Oakleigh and part of Sandringham.
Assessment: Stable, safe ALP

Indi:

Incumbent: Sophie Mirabella (LIB)
Incumbent/Party Run: X Elections won (2001 - Present)
13 Elections won (1977 - Present)
2010 Margin (TPP): 9.94% against ALP
Electoral History: 1901–1906: Protectionist Party
1904–1909: Anti-Socialist Party 
1909–1910: Commonwealth Liberal Party*
1910–1913: ALP
1913–1914: Commonwealth Liberal Party*
1914–1917: ALP
1917–1919: Nationalist Party
1919–1928: Country Party
1928–1931: ALP
1931–1937: United Australia Party
1937–1949: Country Party
1949–1958: LIB
1958–1975: Country Party
1975–1977: National Country Party
1977–present: LIB
Longest Electoral Run:  13 Elections won (1977 - Present) - LIB
State Divisions: Part of Benalla, Benambra and part of Murray Valley.
Assessment: Stable, very safe LIB

Isaacs:

Incumbent: Mark Dreyfus (ALP)
Incumbent/Party Run: 2 Elections won (2007 - Present)
6 Elections won (1996 - Present)
2010 Margin (TPP): 11.02% against LIB
Electoral History: 1969–1974: LIB
1974–1975: ALP
1975–1980: LIB
1980–1990: ALP
1990–1996: LIB
1996–present: ALP
Longest Electoral Run:  6 Elections won (1996 - Present) - ALP
State Divisions: Part of Carrum, part of Cranbourne, part of Dandenong, part of Lyndhurst, part of Mordialloc and part of Sandringham.
Assessment: Variable, safe ALP

Jagajaga:

Incumbent: Jenny Macklin (ALP)
Incumbent/Party Run: 6 Elections won (1996 - Present)
10 Elections won (1984 - Present)
2010 Margin (TPP): 11.52% against LIB
Electoral History: 1984-present: ALP
Longest Electoral Run:  10 Elections won (1984 - Present) - ALP
State Divisions: Part of Bundoora, part of Eltham, part of Ivanhoe and part of Yan Yean.
Assessment: Stable, very safe ALP

Kooyong:

Incumbent: Josh Frydenberg (LIB)
Incumbent/Party Run: 1 Election won (2010 - Present)
26 Elections won (1946 - Present)
Including preceding parties, 34 Elections won (1901 - Present)
2010 Margin (TPP): 7.55% against ALP
Electoral History: 1901–1906: Free Trade Party
1906-1909: Anti-Socialist
1909–1917: Commonwealth Liberal Party*
1917–1922: Nationalist Party
1922–1925: Liberal Union
1925–1931: Nationalist Party
1931–1944: Unived Australia Party
1944–present: LIB
Longest Electoral Run: 
26 Elections won (1946 - Present) - LIB
Including preceding parties, 34 Elections won (1901 - Present) - LIB
State Divisions: Part of Box Hill, part of Burwood, part of Hawthorn and Kew.
Assessment: Stable, very safe LIB

Lalor:

Incumbent: Julia Gillard (ALP)
Incumbent/Party Run: 5 Elections won (1998 - Present)
17 Elections won (1969 - Present)
2010 Margin (TPP): 22.15% against LIB
Electoral History: 1949-1966: ALP
1966-1969: LIB
1969-present: ALP
Longest Electoral Run: 17 Elections won (1969 - Present) - ALP
State Divisions: Part of Altona, part of Lara, part of Melton and Tarneit.
Assessment: Stable, very safe ALP

La Trobe:

Incumbent: Laura Smyth (ALP)
Incumbent/Party Run: 1 Elections won (2010 - Present)
2010 Margin (TPP): 0.91% against LIB
Electoral History: 1949–1972: LIB
1972–1975: ALP
1975–1980: LIB
1980–1990: ALP
1990–2010: LIB
2010–present: ALP
Longest Electoral Run:  9 Elections won (1949 - 1972) - LIB
State Divisions: Part of Bass, part of Bayswater, part of Ferntree Gully, part of Gembrook, part of Monbulk, part of Narre Warren North and part of Narre Warren South.
Assessment: Volatile, tossup

McEwen:

Incumbent: Rob Mitchell (ALP)
Incumbent/Party Run: 1 Elections won (2010 - Present)
2010 Margin (TPP): 5.32% against LIB
Electoral History: 1984–1990: ALP
1990–1993: LIB
1993–1996: ALP
1996–2010: LIB
2010–present: ALP
Longest Electoral Run:  5 Elections won (1996 - 2010) - LIB
State Divisions: Part of Benalla, part of Eltham, part of Gembrook, part of Macedon, Seymour and part of Yan Yean.
Assessment: Volatile, leaning ALP

McMillan:

Incumbent: Russell Broadbent (LIB)
Incumbent/Party Run: 3 Elections won (2004 - Present)
2010 Margin (TPP): 4.41% against ALP
Electoral History: 1949–1955: ALP
1955–1972: LIB
1972–1975: Country Party
1975–1980: LIB
1980–1990: ALP
1990–1993: LIB
1993–1996: ALP
1996–1998: LIB
1998–2004: ALP
2004–present: LIB
Longest Electoral Run:  6 Elections won (1955–1972) - LIB
State Divisions: Part of Bass, part of Gembrook, part of Gippsland South, part of Morwell and Narracan.
Assessment: Variable, leaning LIB

Mallee:

Incumbent: John Forrest (NAT)
Incumbent/Party Run: 7 Elections won (1993 - Present)
11 Elections won (1983 - Present) 
Including the preceding National Country Party and Country Party 25 Elections won (1949 - Present)
2010 Margin (TPP): 24.41% against ALP
Electoral History: 1949–1975: Country Party
1975–1982: National Country Party
1982–present: NAT
Longest Electoral Run: 11 Elections won (1982 - Present)
Including the preceeding National Country Party and Country Party 25 Elections won (1949 - Present)
State Divisions: Part of Lowan, Mildura, part of Rodney and part of Swan Hill.
Assessment: Stable, very safe NAT

Maribyrnong:

Incumbent: Bill Shorten (ALP)
Incumbent/Party Run: 2 Elections won (2007 - Present)
17 Elections won (1969 - Present)
2010 Margin (TPP): 16.86% against LIB
Electoral History: 1906–1909: Protectionist Party
1909–1910: Commonwealth Liberal Party*
1910–1931: ALP
1931–1934: United Australia Party
1934–1955: ALP
1955–1969: LIB
1969–present: ALP
Longest Electoral Run:  17 Elections won (1969 - Present) - ALP
State Divisions: Part of Derrimut, part of Essendon, part of Footscray, part of Kororoit and part of Niddrie.
Assessment: Variable, safe ALP

Melbourne:

Incumbent: Adam Bandt (GRN)
Incumbent/Party Run: 1 Elections won (2010 - Present)
2010 Margin (TPP): 6.04% against ALP
Electoral History: 1901–1904: Protectionist Party
1904–2010: ALP
2010–present: GRN
Longest Electoral Run:  40 Elections won (1906 - 2010) - ALP
State Divisions: Part of Brunswick, part of Essendon, Melbourne, part of Northcote and Richmond.
Assessment: Stable, very safe ALP

Melbourne Ports:

Incumbent: Michael Danby (ALP)
Incumbent/Party Run: 5 Elections won (1998 - Present)
41 Elections won (1906 - Present)
2010 Margin (TPP): 7.56% against LIB
Electoral History: 1901–1906: Protectionist Party
1906–present: ALP
Longest Electoral Run:  41 Elections won (1906 - Present) - ALP
State Divisions: Albert Park, part of Brighton, part of Caulfield, part of Oakleigh and part of Prahran.
Assessment: Stable, very safe ALP

Menzies:

Incumbent: Kevin Andrews (LIB)
Incumbent/Party Run: 7 Elections won (1993 - Present)
10 Elections won (1984 - Present)
2010 Margin (TPP): 8.72% against ALP
Electoral History: 1984–present: LIB
Longest Electoral Run:  10 Elections won (1984 - Present) - LIB
State Divisions: Bulleen, Doncaster, part of Evelyn and part of Warrandyte
Assessment: Stable, very safe LIB

Murray:

Incumbent: Sharman Stone (LIB)
Incumbent/Party Run: 6 Elections won (1996 - Present)
2010 Margin (TPP): 20.35% against ALP
Electoral History: 1949–1975: Country Party
1975–1982: National Country Party
1982–1996: NAT
1996–present: LIB
Longest Electoral Run: 11 Elections won (1949 - 1975) - Country Party
Including following parties, 19 Elections won (1949 - 1996) - NAT/National Country Party/Country Party
State Divisions: Part of Benalla, part of Bendigo East, part of Bendigo West, part of Murray Valley, part of Rodney, Shepparton and part of Swan Hill.
Assessment: Stable, very safe LIB

Scullin:

Incumbent: Harry Jenkins (ALP)
Incumbent/Party Run: 6 Elections won (1996 - Present)
9 Elections won (1987 - Present)
2010 Margin (TPP): 22.25% against LIB
Electoral History: 1986–present: ALP
Longest Electoral Run:  9 Elections won (1987 - Present) - ALP
State Divisions: Part of Bundoora, Mill Park, part of Thomastown and part of Yan Yean.
Assessment: Stable, very safe ALP

Wannon:

Incumbent: Dan Tehan (LIB)
Incumbent/Party Run: 1 Elections won (2010 - Present)
22 Elections won (1955 - Present)
2010 Margin (TPP): 7.29% against ALP
Electoral History: 1901–1906: Free Trade Party
1906–1913: ALP
1913–1917: Commonwealth Liberal Party*
1917–1922: Nationalist
1922–1925: ALP
1925–1929: Nationalist
1929–1931: ALP
1931–1940: United Australia Party
1940–1949: ALP
1949–1951: LIB
1951–1955: ALP
1955–present: LIB
Longest Electoral Run:  22 Elections won (1955 - Present) - LIB
State Divisions: Part of Lowan, part of Polwarth, part of Ripon and South-West Coast.
Assessment: Stable, very safe LIB

Wills:

Incumbent: Kelvin Thomson (ALP)
Incumbent/Party Run: 6 Elections won (1996 - Present)
2010 Margin (TPP): 22.64% against LIB
Electoral History: 1949–1992: ALP
1992–1996: IND
1996–present:
ALP
Longest Electoral Run:  18 Elections won (1949 - 1990) - ALP
State Divisions: Part of Broadmeadows, part of Brunswick, part of Essendon, Pascoe Vale and part of Thomastown.
Assessment: Stable, very safe ALP

* Although listed in blue as a predecessor of the modern Liberal party, it is important to note that these parties are break-away groups and originally part of the Labor Party. Thus they cannot be viewed as entirely aligned with the modern Labor or Liberal positions. The same non-equivalence is true -- though to a lesser extent -- with the other, now defunct, historical parties.

** An Independent Labor candidate (for example) is an Independent who will by and large act as, and believes in the same principles as, a Labor candidate. 
For a really good explanation of the insanity that ensues, I recommend Dr Kevin Bonham's post What is an independent liberal, which contains a gem of a discussion about endorsed unendorsed candidates and unendorsed unendorsed candidates.

*** Although now an Independent, Gary Gray won this seat as a Liberal.

Wednesday, 26 June 2013

Obviously the events of tonight will change many things. As a result, I may divert from my schedule of one post per week.

Factors such as the date of the election -- which may now vary from August 3 to November 30 -- will dictate the pace and content of upcoming posts. I will endeavour to maintain the schedule of upcoming posts regarding my seat-by-seat analysis, however we may see additional posts in between.

I will not, however, be posting any material as a result of tonights events until I have had time to consider the speaches, election date, changes to the front bench and everything that follows over the next couple of days. I trust it will not be too hard for you, my loyal readers, to get your political fix elsewhere until informed, intelegent commentary (and my two cents as well...) are available online.

--- The PsephologyKid

Saturday, 22 June 2013

District Run-Down (2 of 6) - Western Australia

We continue our look at the seats of this election with the Western Australian electoral districts. I should stress that these are not predictions, merely the results of analysis. This may serve as a rough approximation of how a seat would be likely to fall if the polling were neck-and-neck and no other factors were at play -- a baseline of each seat's bias to serve as a starting point when we come to make our predictions.

If anyone should disagree with this analysis, feeling that a seat is safer or more marginal than reported here or that some vital factor independent of the current electoral cycle has not been accounted for, feel free (as always) to comment. This series of posts is not merely part of my own working out, it is intended as a point from which any interested person can begin to form their own predictions.

This is the second of six such posts, scheduled thusly:
      June 15th: South Australia (X)
June 22nd: Western Australia
June 29th: Victoria
July 6th: Queensland 
July 13th: New South Wales
July 20th: Tasmania, Northern Territory and Australian Capital Territory
Now, without further ado:

Western Australia:

Western Australia's economy is driven largely by the primary sector, specifically the extraction and processing of mineral and petroleum resources, although other chemical and agricultural exports are also major players (source). The state government is bicameral and based on the Westminster system, and has arguably been the strongest defender of state autonomy, with secession from the Federation a recurring theme in the state's political history. The lower house (Legeslative Assembly) contains 31 Liberal members, 21 Liberal and 7 Nationals. The upper house (Legislative Council) is held by 17 Liberal councillors, 11 Labor councillors, 5 Nationals, 2 Greens and 1 councillor from the Shooters and Fishers party.

The state contains 15 electoral districts, and as a state elects 6 Senators to the Federal Parliament.

How to Read These Summaries:

Incumbent: Incumbent lists the current member for the seat and their current party.

Incumbent/Party Run: Incumbent run provides the number of elections won by the current member, and the years of those elections in parentheses. By-elections are ignored.

A second line may be present and indicate the number of elections won by the current member's party, if this is different to the number won by the current member. Again the years of those elections in parentheses, and again by-elections are ignored.

2010 Margin (TPP): This is the margin by which the seat was won after the last redistribution of preferences in the 2010 federal election, and who this margin was against.

Electoral History: A list of previous incumbent parties from the foundation of the seat to the present.

Longest Electoral Run: The most elections won in a row in this seat by one party, with the years of those elections in parentheses and the party which won the seat in those elections.

State Divisions: The state seats within this federal seat. The seat names are coloured according to their current incumbent (blue for Liberal, red for ALP, dark yellow for Nationals). The last state election was in 2013.

Assessment: An assessment of the seats political history - that is, whether the seat is traditionally of one party or another. This is only approximated from the data here, does not constitute a prediction and may differ from the current incumbent's party.

Brand:

Incumbent: Gary Gray (ALP)
Incumbent/Party Run: 2 Elections won (2007 - Present)
10 Elections won (1984 - Present)
2010 Margin (TPP): 3.33% against LIB
Electoral History: 1984-Present: ALP
Longest Electoral Run:  10 Elections won (1984 - Present) - ALP
State Divisions: Kwinana, part of Mandurah, Rockingham and Warnbro
Assessment: Stable, safe ALP (despite small margin and short history)


Canning:

Incumbent: Don Randall (LIB)
Incumbent/Party Run: 4 Elections won (2001 - Present)
2010 Margin (TPP): 2.19% against ALP
Electoral History: 1949–1961: Country Party
1961–1963: LIB
1963–1974: Country Party
1974–1983: LIB
1983–1996: ALP
1996–1998: LIB
1998–2001: ALP
2001–present: LIB
Longest Electoral Run: 5 Elections won (1949 - 1961) - Country Party, (1983-1996) - ALP
State Divisions: Part of Armadale, part of Darling RangeDawesville, part of Mandurah, part of Murray-Wellington and part of Wagin
Assessment: Variable, leaning to LIB


Cowan:

Incumbent: Luke Simpkins (LIB)
Incumbent/Party Run: 2 Elections won (2007 - Present)
2010 Margin (TPP): 6.29% against ALP
Electoral History: 1984–1993: ALP
1993–1998: LIB
1998–2007: ALP
2007–present: LIB
Longest Electoral Run: 3 Elections won (1984–1993) - ALP, (1998–2007) - ALP
State Divisions: Part of Girrawheen, Kingsley, part of Nollamara, part of Wanneroo and part of West Swan
Assessment: Volatile, tossup


Curtin:

Incumbent: Julie Bishop (LIB)
Incumbent/Party Run: 5 Elections won (1998 - Present)
2010 Margin (TPP): 16.19% against ALP
Electoral History: 1949-1996: LIB
1996-1998: IND
1998-Present: LIB
Longest Electoral Run: 19 Elections won (1949 - 1996) - LIB
State Divisions: Churchlands, part of Cottesloe, Nedlands, part of Perth and part of Scarborough
Assessment: Stable, very safe LIB


Durack:

Incumbent: Barry Haase (LIB)
Incumbent/Party Run: 1 Election won (2010 - Present)
2010 Margin (TPP): 3.67% against ALP
Electoral History: 2010 - Present: LIB
Longest Electoral Run: 1 Election won (2010 - Present) - LIB
State Divisions: Part of Central Wheatbelt, part of Geraldton, part of Kalgoorlie, Kimberly, part of Moore, North West and part of Pilbara
Assessment: Tossup (insufficient data)
N.B.: Any assessment of Durack, which was formed last election, must be premature given only one piece of data.
The state divisions that make up Durack might indicate that a Nationals candidate would do well here. Though they received less than 18% of the primary vote in 2010, things look better for them since the 2013 state election. However, if I understand the Liberal-National agreement, the Nats will not challenge the seat since it has a Liberal Incumbent. However, this was not the case in O'Connor in 2010...


Forrest:

Incumbent: Nola Marino (LIB)
Incumbent/Party Run: 2 Elections won (2007 - Present)
16 Elections won (1972 - Present)
2010 Margin (TPP): 8.74% against ALP
Electoral History: 1922–1943: Country Party
1943–1949: ALP
1949–1969: LIB
1969–1972: ALP
1972–present: LIB
Longest Electoral Run: 16 Elections won (1972 - Present) - LIB
State Divisions: Part of Blackwood-Stirling, Bunbury, Collie-Preston, part of Murray-Wellington and Vasse
Assessment: Stable, very safe LIB


Fremantle:

Incumbent: Melissa Parke (ALP)
Incumbent/Party Run: 2 Elections won (2007 - Present)
30 Elections won (1934 - Present)
2010 Margin (TPP): 5.70% against LIB
Electoral History: 1901–1903: Free Trade Party
1903–1906: ALP
1906–1909: Western Australian Party**
1909–1913: Commonwealth Liberal Party*
1913–1916: ALP
1913–1916: National Labor Party*
1917–1922: Nationalist Party
1922–1928: IND
1928–1931: ALP
1931–1934: United Australia Party
1934–present: ALP
Longest Electoral Run: 30 Elections won (1934 - Present) - ALP
State Divisions:  Part of Alfred Cove, Cockburn, part of Cottesloe, Fremantle, part of Jandakot and part of Willagee.
Assessment: Stable, very safe ALP


Hasluck:

Incumbent: Ken Wyatt (LIB)
Incumbent/Party Run: 1 Election won (2010 - Present)
2010 Margin (TPP): 0.57% against ALP
Electoral History: 2001–2004: ALP
2004–2007: LIB
2007–2010: ALP
2010–present: LIB
Longest Electoral Run: 1 Election won (2001–2004) - ALP, (2004–2007) - LIB, (2007–2010) - ALP, (2010–present) - LIB
State Divisions: Part of Belmont, part of Cannington, part of Forrestfield, Gosnells, part of Kalamunda, part of Midland, part of Southern River and part of West Swan
Assessment: Tossup


Moore:

Incumbent: Mal Washer (LIB)
Incumbent/Party Run: 5 Elections won (1998 - Present)
2010 Margin (TPP): 11.19% against ALP
Electoral History: 1949–1958: Country Party
1958–1961: LIB
1961–1974: Country Party
1974–1983: LIB
1983–1990: ALP
1990–1995: LIB
1995–1998: IND
1998–present: LIB
Longest Electoral Run: 5 Elections won (1961–1974) - Country Party, (1998 - Present) - LIB
State Divisions: Part of Carine, Hillarys, Joondalup, part of Mindarie, Ocean Reef and part of Wanneroo
Assessment: Variable, safe LIB


O'Connor:

Incumbent: Tony Crook (NAT)
Incumbent/Party Run: 1 Elections won (2010 - Present)
2010 Margin (TPP): 3.56% against LIB
Electoral History: 1980-2010: LIB
2010 - Present: NAT
Longest Electoral Run: 11 Elections won (1980 - 2010) - LIB
State Divisions: Albany, part of Blackwood-Stirling, part of Central Wheatbelt, Eyre, part of Kalgoorlie, part of Pilbara and part of Wagin
Assessment: Variable, leaning to NAT


Pearce:

Incumbent: Judi Moylan (LIB)
Incumbent/Party Run: 7 Elections won (1993 - Present)
8 Elections won (1990 - Present)
2010 Margin (TPP): 8.86% against ALP
Electoral History: 1990-Present: LIB
Longest Electoral Run: 8 Elections won (1990 - Present) - LIB
State Divisions: Part of Central Wheatbelt, part of Darling Range, part of Kalamunda, part of Midland, part of Mindarie, part of Moore, part of Swan Hills and part of West Swan
Assessment: Stable, safe LIB


Perth:

Incumbent: Stephen Smith (ALP)
Incumbent/Party Run: 7 Elections won (1993 - Present)
13 Elections won (1983 - Present)
2010 Margin (TPP): 5.88% against LIB
Electoral History: 1901–1909: ALP
1909–1917: Commonwealth Liberal Party
1917–1929: Nationalist Party
1929–1929: IND Nationalist***
1929–1931: Nationalist Party
1931–1943: United Australia Party
1943–1955: ALP
1955–1969: LIB
1969–1975: ALP
1975–1983: LIB
1983–present: ALP
Longest Electoral Run: 13 Elections won (1983 - Present) - ALP
(Including predecessors of LIB and aligned Independents as one party, there were also 13 Elections won (1909 - 1943))
State Divisions: Bassendean, Maylands, part of Morley, part of Mount Lawley and part of Perth
Assessment: Stable, safe ALP


Stirling:

Incumbent: Michael Keenan (LIB)
Incumbent/Party Run: 3 Elections won (2004 - Present)
2010 Margin (TPP): 5.55% against ALP
Electoral History: 1955–1958: ALP
1958–1961: LIB
1961–1972: ALP
1972–1983: LIB
1983–1993: ALP
1993–1998: LIB
1998–2004: ALP
2004–present: LIB
Longest Electoral Run: 5 Elections won (1972–1983) - LIB
State Divisions: Balcatta, part of Carine, part of Girrawheen, part of Morley, part of Mount Lawley, part of Nollamara and part of Scarborough
Assessment: Variable, safe LIB


Swan:

Incumbent: Steve Irons (LIB)
Incumbent/Party Run: 2 Elections won (2007 - Present)
2010 Margin (TPP): 2.53% against ALP
Electoral History: 1901–1909: Protectionist Party
1909–1917: Commonwealth Liberal Party*
1917–1918: Nationalist Party
1918–1919: ALP
1919–1943: Country Party
1943–1943: IND Country Party***
1943–1946: ALP
1946–1949: Country Party
1949–1954: LIB
1954–1955: ALP
1955–1969: LIB
1969–1975: ALP
1975–1980: LIB
1980–1996: ALP
1996–1998: LIB
1998–2007: ALP
2007–present: LIB
Longest Electoral Run: 9 Elections won (1919 - 1943) - Country Party
State Divisions: Part of Belmont, part of Cannington, part of Riverton, South Perth and Victoria Park
Assessment: Volatile leaning to LIB


Tangney:

Incumbent: Dennis Jenson (LIB)
Incumbent/Party Run: 3 Elections won (2004 - Present)
10 Elections won (1984 - Present)
2010 Margin (TPP): 12.32% against ALP
Electoral History: 1974–1975: ALP
1975–1977: LIB
1977–1977: Progress Party
1977–1983: LIB
1983–1984: ALP
1984–present: LIB
Longest Electoral Run: 10 Elections won (1984 - Present) - LIB
State Divisions: Part of Alfred Cove, Bateman, part of Jandakot, part of Riverton, part of Southern River and part of Willagee
Assessment: Stable, very safe LIB


*Although listed in blue as a predecessor of the modern Liberal party, it is important to note that these parties are break-away groups and originally part of the Labor Party. Thus they cannot be viewed as entirely aligned with the modern Labor or Liberal positions. The same non-equivalence is true -- though to a lesser extent -- with the other, now defunct, historical parties.

**The Western Australian Party did not officially merge into the Commonwealth Liberal Party, but many of its members (including its only elected member in Fremantle) did join the CLP. The WA Party was formed from members of the Protectionist Party and Anti-Socialist Party, and thus can be seen as another subgroup of the predecessors of the modern Liberal Party. However, it is an anomaly, so I have included it under its official party colour (cyan) instead of Liberal blue.

***If you are confused by Independents who are also party affiliated, then you are in good company. To oversimplify, an Independent Labor candidate (for example) is an Independent who will by and large act as, and believes in the same principles as, a Labor candidate. 

For a really good explanation of the insanity that ensues, I recoment Dr Kevin Bonham's post What is an independent liberal from the Tasmanian LegCo elections this year, which contains a discussion about endorsed unendorsed candidates and unendorsed unendorsed candidates.

Saturday, 15 June 2013

District Run-Down (1 of 6) - South Australia

Once again I will not be available next week to write the blogpost, so I will be preparing it in advance. It may not be topical, but at least it will be available. I bring this up here because next week's post will be a continuation of a long post-athon summarising the seats of this election.

Today we start with my home state of South Australia, and run down through the other states in the order that they are likely to be most relevant to my readers. Second W.A., where I have a couple of at least semi-regular readers, then Victoria, where I may have another. After that we move to Queensland where I have a contact who might occasionally take an interest.

New South Wales comes next, purely as a result of being geographically larger and economically more influential than Tasmania. With that last state I will also cover the N.T. and A.C.T.:

June 15th: South Australia
June 22nd: Western Australia
June 29th: Victoria
July 6th: Queensland 
July 13th: New South Wales
July 20th: Tasmania, Northern Territory and Australian Capital Territory
And so, to business:

South Australia:

The largest employment groups in South Australia are health care and support services, retail and manufacturing (source). The state government is bicameral and based on the Westminster system. The lower house (House of Assembly) contains 26 Labor members, 18 Liberal and 3 Independent. The upper house (Legislative Council) is held by 8 Labor councillors, 7 Liberals, 2 councillors each from Family First, Greens and No Pokies and 1 from Dignity 4 Disability.

The state contains 11 electoral districts, and as a state elects 6 Senators to the Federal Parliament.

How to Read These Summaries:

Incumbent: Incumbent lists the current member for the seat and their current party.

Incumbent/Party Run: Incumbent run provides the number of elections won by the current member, and the years of those elections in parentheses. By-elections are ignored.

A second line may be present and indicate the number of elections won by the current member's party, if this is different to the number won by the current member. Again the years of those elections in parentheses, and again by-elections are ignored.

2010 Margin (TPP): This is the margin by which the seat was won after the last redistribution of preferences in the 2010 federal election, and who this margin was against.

Electoral History: A list of previous incumbent parties from the foundation of the seat to the present.

Longest Electoral Run: The most elections won in a row in this seat by one party, with the years of those elections in parentheses and the party which won the seat in those elections.

State Divisions: The state seats within this federal seat. The seat names are coloured according to their current incumbent (red for ALP, Blue for Liberal, grey for Independents). The last state election was in 2010. Port Adelaide and Ramsay had simultaneous by-elections in 2012. Both remained ALP seats, were unchallenged by Liberal candidates and were won with a margin against an Independent.

Assessment: An assessment of the seats political history - that is, whether the seat is traditionally of one party or another. This is only approximated from the data here, does not constitute a prediction and may differ from the current incumbent's party.

Adelaide:

Incumbent: Kate Ellis (ALP)
Incumbent/Party Run: 3 Elections won (2004 - Present)
2010 Margin (TPP): 7.69% against LIB
Electoral History: 1903-1908: Protectionist Party
1908-1919: ALP
1919-1922: Nationalist Party
1922-1931: ALP
1931-1943: United Australia Party
1943-1966: ALP
1966-1969: LIB
1969-1988: ALP
1988-1990: LIB
1990-1993: ALP
1993-2004: LIB
2004-Present: ALP
Longest Electoral Run: 9 Elections won (1943 - 1966) - ALP
State Divisions: Adelaide, part of Ashford, part of Bragg, part of Croydon, part of Enfield, part of Norwood, part of Torrens, Unley and part of West Torrens.
Assessment: Volatile, leaning to ALP

Barker:

Incumbent: Patrick Secker (LIB)
Incumbent/Party Run: 5 Elections won (1998 - Present)
26 Elections won (1946 - Present)
2010 Margin (TPP): 12.88% against ALP
Electoral History: 1903-1906: Protectionist Party
1906-1909: Anti-Socialist Party
1909-1917: Commonwealth Liberal Party*
1917-1922: Nationalist Party
1922-1925: Liberal Union
1925-1931: Nationalist Party
1931-1934: United Australia Party
1934-1940: Country Party
1940-1944: United Australia Party
1944-Present: LIB
Longest Electoral Run: 26 Elections won (1946 - Present) - LIB
(Including predecessors of LIB, 42 Elections won (1903 - Present))
Component Divisions: Chaffey, part of Hammond, part of Kavel, part of Light, Mackillop, Mount Gambier, part of Schubert and part of Stuart
Assessment: Stable, very safe LIB

Boothby:

Incumbent: Andrew Southcott (LIB)
Incumbent/Party Run: 6 Elections won (1996 - Present)
25 Elections won (1949 - Present)
2010 Margin (TPP): 0.75% against ALP
Electoral History: 1903–1911: ALP
1911–1913: Commonwealth Liberal Party*
1913–1916: ALP
1916–1917: National Labor Party*
1917–1922: Nationalist Party
1922–1925: Liberal Union
1925–1928: Nationalist Party
1928–1931: ALP
1931–1943: United Australia Party
1943–1949: ALP
1949-present: LIB
Longest Electoral Run: 25 Elections won (1949 - Present) - LIB
Component Divisions: part of Bright, part of Davenport, part of Elder, part of Fisher, part of Mitchell, part of Morphett, part of Unley and Waite
Assessment: Stable, safe LIB (despite small margin)

Grey:

Incumbent: Rowan Ramsey (LIB)
Incumbent/Party Run: 2 Elections won (2007 - Present)
7 Elections won (1993 - Present)
2010 Margin (TPP): 11.16% against ALP
Electoral History: 1903–1916: ALP
1916–1917: National Labor Party*
1917–1922: Nationalist Party
1922–1931: ALP
1931–1937: United Australia Party
1937–1940: Country Party
1940–1943: United Australia Party
1943–1966: ALP
1966–1969: LIB
1969–1993: ALP
1993–present: LIB
Longest Electoral Run: 10 Elections won (1943 - 1966) - ALP
Component Divisions: Flinders, part of Frome, Giles, part of Goyder and part of Stuart
Assessment: Variable, safe LIB

Hindmarsh:

Incumbent: Steve Georganas (ALP)
Incumbent/Party Run: 3 Elections won (2004 - Present)
2010 Margin (TPP): 5.70% against LIB
Electoral History: 1903–1916: ALP
1916–1917: National Labor Party*
1917–1919: Nationalist Party
1919–1993: ALP
1993–2004: LIB
2004–present: ALP
Longest Electoral Run: 29 Elections won (1919 - 1993) - ALP
Component Divisions: Part of Ashford, part of Colton, part of Croydon, part of Elder, part of Lee, part of Morphett and part of West Torrens
Assessment: Variable, safe ALP

Kingston:

Incumbent: Amanda Rishworth ALP
Incumbent/Party Run: 2 Elections won (2007 - Present)
2010 Margin (TPP):
Electoral History: 1949–1951: LIB
1951–1966: ALP
1966–1969: LIB
1969–1975: ALP
1975–1983: LIB
1983–1996: ALP
1996–1998: LIB
1998–2004: ALP
2004–2007: LIB
2007–present: ALP
Longest Electoral Run: 6 Elections won (1951 - 1966)
Component Divisions: Part of Bright, part of Finniss, part of Fisher, Kaurna, part of Mitchell, Mawson and Reynell
Assessment: Volatile, tossup

Makin:

Incumbent: Tony Zappia (ALP)
Incumbent/Party Run: 2 Elections won (2007-Present)
2010 Margin (TPP): 12.20% against LIB
Electoral History: 1984-1996: ALP
1996-2007: LIB
2007-Present: ALP
Longest Electoral Run: 4 Elections won (1984-1996) - ALP, (1996-2007) - LIB
Component Divisions: Part of Florey, part of Little Parra, part of Newland, Playford and Wright
Assessment: Volatile, safe ALP

Mayo:

Incumbent: Jamie Briggs (LIB)
Incumbent/Party Run: 1 Election won (2008-Present)
10 Elections won (1984-Present)
2010 Margin (TPP): 17.35% against ALP
Electoral History: 1984-Present: LIB
Longest Electoral Run: 10 Elections won (1984-Present) - LIB
Component Divisions: Part of Bragg, part of Davenport, part of Finniss, part of Fisher, part of Hammond, part of Heysen, part of Kavel, part of Morialta, part of Newland and part of Schubert
Assessment: Stable, very safe LIB

Port Adelaide:

Incumbent: Mark Butler (ALP)
Incumbent/Party Run: 2 Elections won (2007-Present)
25 Elections won (1949-Present)
2010 Margin (TPP): 20.03% against LIB
Electoral History: 1949-Present: ALP
Longest Electoral Run: 25 Elections won (1949-Present) - ALP
Component Divisions: Cheltanham, part of Colton, part of Croydon, part of Enfield, part of Lee, Port Adelaide, part of Ramsay and part of Taylor
Assessment: Stable, very safe ALP

Sturt:

Incumbent: Christopher Pyne (LIB)
Incumbent/Party Run:  7 Elections won (1993-Present)
16 Elections won (1972-Present)
2010 Margin (TPP): 3.43% against ALP
Electoral History: 1949–1954: LIB
1954–1955: ALP
1955–1969: LIB
1969–1972: ALP
1972–present: LIB
Longest Electoral Run: 16 Elections won (1972-Present) - LIB
Component Divisions: Part of Bragg, part of Florey, Hartley, part of Morialta, part of Newland, part of Norwood, part of Torrens and part of Unley.
Assessment: Stable, safe LIB

Wakefield:

Incumbent: Nick Champion (ALP)
Incumbent/Party Run: 2 Elections won (2007-Present)
2010 Margin (TPP): 11.95% against LIB
Electoral History: 1903–1909: IND
1909–1917: Commonwealth Liberal Party*
1917–1922: Nationalist Party
1922–1925: Liberal Union
1925–1928: Nationalist Party
1928–1929: Country Party
1929–1931: Nationalist Party
1931–1938: United Australia Party
1938–1940: ALP
1940–1943: United Australia Party
1943–1946: ALP
1946-2007: LIB
2007–present: ALP
Longest Electoral Run: 23 Elections won (1946-2007) - LIB
Component Divisions: Part of Frome, part of Goyder, part of Light, part of Little Parra, Napier, part of Ramsay, part of Schubert, part of Stuart and part of Taylor.
Assessment: Variable, leaning to ALP

*Although listed in blue as a predecessor of the modern Liberal party, it is important to note that these parties are break-away groups and originally part of the Labor Party. Thus they cannot be viewed as entirely aligned with the modern Labor or Liberal positions. The same non-equivalence is true -- though to a lesser extent -- with the other, now defunct, historical parties.

Saturday, 8 June 2013

Aves Et Apes (Et Vespertili)

Australia was federated in 1901, and our first federal parliament was replaced by an election held on December 16, 1903.

110 years on, we are facing a very different election. A lot has changed in the last century. Twenty years ago mobile phones and the Internet were emerging, groundbreaking developments.

Only fifty years ago Aboriginal Australians were not counted in the calculation of how many seats each state got in Parliament. They would not be counted until the passing of the 1967 referendum (although they were legally allowed to vote since the introduction of Australian Citizenship in 1949). The idea of a female Prime Minister in Australia, or an African-American President in the US, were seen as distant dreams by idealists.

Seventy years ago, during the Second World War, cars were still novel and home television was a new emergence.

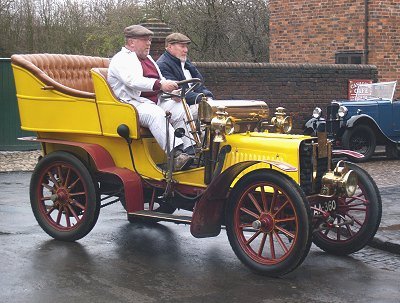
In 1903, the only one of these developments considered to be plausible in a practical way was the car. And back then they looked like this:

On the upside there was no Fast and Furious franchise;
on the downside, a 1903 Fast and Furious would have been great.


These are just some of the changes that have altered the basics of political life. Most people would appreciate and embrace the benefits these advantages have brought. Politics has a role to play in encouraging this progress, particularly social progress. Sadly, further progress is needed.

Today there are 66 women in parliament (37 in the House of Reps and 29 in the Senate) which is around one-in-three. This is important not only because it brings a diverse range of views and opinions to the government, but because - to compare government to business as many misguided politicians do - repeated studies have shown companies perform significantly better when there is gender diversity in leadership positions.

This is promising, although there is obvious room for improvement. I reported a while back on a study that suggested that donkey voting is significantly less likely if it gives the first preference to a woman. It is not impossible that male candidates may have an edge in Australian elections, being seen as stronger, firmer and less emotional by a small but crucial number of voters.

Da-na-na-na Na-na-na-na Batman!

Recently in the Electoral District of Batman, publicly recognised as the coolest named electoral district in the country, one of Labor's most promising female potential candidates has pulled out of the race. Now, here's a little info about Batman:

Fast and Furious would be better with Batmobiles, too...
Firstly, it's pronounced /beɪt·mÉ™n/, but we will forgive them that.

Secondly, it has been around since federation. It has been a Labor seat since before the Second World War, with the exception of independent Sam Benson in 1966. Benson was the first independent to win a seat in 20 years, and had the advantage that he had previously held the seat for four years as a Labor candidate.

Thirdly, in the last election Batman was retained with over 52% of the primary vote. That means a swing of more than 2% might still not win another party the seat even if they get all the other preferences! The two party preferred opponent here is not the Liberal party, or any other Coalition party. In second place are the left-wing Australian Greens. And even if the Greens win the seat, they will side with Labor on most of the votes in parliament. So it is an understatement to state that it is an understatement to state that this is safe Labor ground. Try and get your head around that!

In the past, getting preselected by the ALP for this seat was basically the same as recieving a free government pension. This is less the case with the slide against Labor over the last few years, but Batman is still a much prized seat.

On the last day of May, ACTU boss Ged Kearney was thought to be the running to be Batman's first female member by several sources, saying that she was "considering it". On the first day of June she announced she would not run (again reported by several sources). It has been suggested that she was pressured not to run by the right-wing faction of the party who wish to support Senator David Feeney. If the name is familiar, it is because he was supposedly one of the "faceless men".

I figure they at lest have mouths, since they are able to pressure people into things.
Now perhaps she was pressured not to run. And perhaps that is the reason Ged pulled out of the race. And perhaps the pressure was because she was a woman.

Or perhaps not.

Either way the story has certainly been spun that way. The implication is always that Labor's faceless men -- who put Gillard in power -- are sexists. Regardless of the truth of any of the assumptions, if we accept Kearney was opposed on the grounds of her sex then there is an important question that is not asked: was the opposition to her as a woman the result of sexism in the party, or is it the result of political tactics. Perhaps it is the voters, not the politicians, who are sexist.

If, for example, women polled 3% less support than men - all else being equal - then it would be too dangerous to put a woman in the seat of Batman. After all, if Labor loses the seat then Kearney would not have got into Parliament anyhow.

Now I'm not going to get into my personal feelings on the subject, or whether such polling information would justify encouraging Ms Kearney to pull out. I am not convinced her sex was a factor at all, and I believe it is quite possible that no pressure was applied, since the right would have backed Feeney anyhow and Ms Kearney may well have known that she would have been trounced in the pre-selection.

I am merely interested in the statistical question; do female candidates receive less votes? Already I've mentioned this may be true purely from the donkey-vote point of view, but does sexual discrimination at the ballot stretch further than this? Even putting aside the social equality issue, it is an interesting question purely from a predictive psephological point of view.

Ladies and Gentlemen:

There are some quick stats on gender provided by the AEC.

Last election there were 619 men nominated as candidates, and only 230 women. Women, therefore, made up only about 27% of the candidates. Looking at the two major parties, women made up only 31% of ALP candidates and 20% of the Liberal party. Including the Nationals, CLP and LNQ, this dropped to just over 19% of Coalition candidates. Data for all of the parties are provided below:

Data from the AEC.
However, this may not entirely be the fault of the political parties. Less than 21% of Independents were women, suggesting fewer women are trying to get into politics in the first place. Perhaps politically savvy women feel that they will be at a disadvantage in an election. Perhaps the persistent problem of wage inequality makes running a campaign unaffordable for many female would-be-politicians. Perhaps the expectation on a mother to raise her children while the father works dissuades potential leaders from entering the arena.

However I personally know many strong, determined and intelligent women who would (and will, and do) make fantastic leaders outside of politics. I cannot believe that if any of these women had the specific ambition of entering government they could not at least get onto the ballot. But then perhaps I move in similar circles to the 21% who make it.

In the early days of women in the workforce, the hard part was not getting jobs. Female secretaries and assistants were not uncommon. The problem was moving up the ladder. The glass ceiling. The invisible barrier between women and promotion to the top.

Getting onto the ballot is not the hard part. It is getting elected that is the real contest. After all, the question we are chiefly concerned with this week is voter responses to female candidates, since these may explain the behaviours of parties and the reluctance of would-be Independents.

With women making less than 27.1% of the candidates, and yet over 29.2% of the parliament, it might seem that women have no difficulty getting elected once on the ballot.

Now a lot of my calculations here use imperfect data, back of the envelope calculations and a subjective selection of which parties to include or exclude from those calculations. I am the first to admit that my data is biased and lacks a lot of finesse that you might expect from a professional, but I am not a professional and I don't pretend to be. I also try to announce those biases wherever I spot them.

I am purely interested in developing rough systems that let me approximate electoral outcomes, so I have no problem with people who subjectively choose to take that simplistic stat and run with it. However I want to delve a little deeper and try and weed out some of the other possible variables throwing up some interferrence.

For example, if parties are concerned that female candidates may be a liability in close-run seats, then women will mostly stand in safe seats, and it should be no surprise that they are overrepresented in the parliament (as a proportion of the candidates, I mean). Also pro-women PACs like EMILY's list may help some women across the line once pre-selected, which may counter the general voting trend for those other, unsupported candidates.

Likewise it would prove nothing to look at the percentage of the primary vote women get in such seats. Instead, I'm going to look at swing for or against women as opposed to men. While this won't actually show how women perform on their own merits, it should indicate if support for women is subject to the tides of public opinion more than that of men.

The thing is, I don't thing many people go to the ballot thinking 'I won't vote for A because she is a woman'. I think how an individual votes is a cocktail of many factors, and policy - for example - will normally trump sex.

Here is my hypothesis on how sex would influence voters: if a voter is subject to this hypothetical sexist influence, it could determine which way the vote falls in an otherwise equal contest. If the general swing is against a party, the gender of a candidate could be enough to push the vote over the line to the other side. Conversely, when the swing is towards a candidate, that candidate's sex could be enough to repel some of the wave. If this were the case we would therefore expect to see swings skewed towards candidates of one sex and away from the other.

As I said, I try to announce my biases. In the following analysis I have made some subjective choices regarding the statistics I use, and which seats I look at:

For simplicity I'm going to look at the swing in the TPP House of Representatives vote and ignore any contest where both TPP candidates are of the same sex, or where the TPP contest is not between Labor and the Coalition. I'm only looking at the 2010 federal election, since attitudes to women have changed over time and I want to keep to the most recent data.

Data from the AEC.

Before we start any analysis, a little background on these seats. In 2010 the average magnitude of the swing for all seats was marginally greater than 4% of the voting public. The average magnitude for these seats is in the range of 3.5%, so these seats were less volatile. This does not mean they were safer in terms of proportion of seats changing hands or size of their margins, merely that the net change in voter opinion was not as extreme in these seats as in others.

The average swing against the ALP in these 54 seats is around 2.2. Where Labor's candidate was the female in the equation this dropped to less than 1.9%. Where the Coalition's candidate was female, swing away from Labor averaged closer to 2.9%. In other words, the average swing was in fact skewed toward the female candidates. If anything female candidates perform better than men in elections (in terms of swing, at least.)

Now I haven't factored in incumbency. Nor have I factored in the possibility that some of these candidates may not be the same person (or even the same sex as the person) who ran in 2007 (and thus against whom the swing's baseline is calculated). However it is worth noting that of the 16 seats above that exhibited against-the-trend swings towards Labor, 13 were towards female candidates.

So perhaps that simple back-of-the-envelope equation we did before is right. Perhaps, once on the ballot, women do not struggle any more than men to get elected. It would seem that pre-selection is the actual limiting factor.

Not so much a glass ceiling as a glass doorway.

Saturday, 1 June 2013

How to Hold an Election

From an electoral perspective, not much is happening around this time of year. The initial election buzz has worn off the media, and there won't be any solid stuff to write about candidates or interesting seats until the writs are issued in August and we know who we've got on the ballots.

There is, however, plenty to write about still. The problem is that most of the useful (and plenty of useless) analytical stuff has either already been covered here (past voting trends, margins etc.) or is not yet available (final polling data etc.).

I could (and still might) get some more ABS maps and compare various demographics with past voting trends to confirm or refute the common impressions that, for example, the elderly more often vote for the Coalition and urban populations regularly vote Labor. However, the results will be a little vague as a result of trying to match ABS statistical divisions with electorates. If I have the time I could actually look up the actual census data for a more detailed and accurate analysis.

I could also do a seat-by-seat breakdown for each state and look in detail at voting history, attitudes and demographics, so look forward to that! (I'll try to keep it interesting for people more normal than myself, I promise.)

This week, however, I'm going to look at how an election is actually run. I've already covered how to vote, and I'll probably return to that closer to the election. This is the other half of that - the rules that govern everything except the voters.

Two Thirds of the Way to Anarchy:

The Government cannot just have an election of its own free will. If it could, then it could also not have an election of its own free will. As everyone knows, there are certain rules that govern federal and state/territory elections. For example, under normal circumstances there must be an election within three years and ninety-eight days of the return of the writs for the last election (we'll get to writs later). These rules are laid out in the constitution (or: The Commonwealth of Australia Constitution Act) which serves as the first law of the country, and upon which every other law, bill, political position, electoral process and just about everything else is based.

So the first question is: 'why is the maximum time between an election (under normal circumstances) three years and ninety-eight days'. It does seem a little odd, but that is because there are actually four periods covered. The first comes from Section 5 of the Constitution:
"After any general election the Parliament shall be summoned to meet not later than thirty days after the day appointed for the return of the writs."
The Parliament then lasts for a maximum of three years, as ascribed by Section 28. This is measured from the first sitting:
"Every House of Representatives shall continue for three years from the first meeting of the House, and no longer, but may be sooner dissolved by the Governor‑General"
This makes three years, thirty days. The next ten are the maximum delay between end of the sitting Parliament and the issuing of the writs for the next election. Or, as Section 32 puts it:
"After the first general election, the writs shall be issued within ten days from the expiry of a House of Representatives or from the proclamation of a dissolution thereof."
The final fifty-eight days are the maximum delay between the issuing of the writs and the election. This comes not from the constitution, but form the Commonwealth Electoral Act 1918 (or CEA), and is a combination of Section 156, subsection (1):
"Subject to subsection (2), the date fixed for the nomination of the candidates shall not be less than 10 days nor more than 27 days after the date of the writ."
and Section 157:
The date fixed for the polling shall not be less than 23 days nor more than 31 days after the date of nomination
However, note that I always qualified the timeline with the phrase "under normal circumstances". That was my not-so-subtle way of covering myself, because there is one particular situation where this changes. The secret is in that little introductory clause for CEA Section 156, Subsection (1):

"Subject to subsection (2),..."

Well, subsection (2) states that:
Where a candidate for an election dies, after being nominated and before 12 o'clock noon on the day fixed by the writ as the date of nomination for the election, the day fixed as the date of nomination for the election shall, except for the purposes of section 157, be taken to be the day next succeeding the day so fixed
In other words, if a candidate dies before midday on the day of nomination, the day of nomination is delayed 24 hours out of respect, and possibly to allow his/her name to be removed from the ballots.

This stretches the time between elections to three years, ninety-nine days. Now I know what you're thinking. You're thinking that a systematic, organised campaign of assassinating candidates before midday, each day from nomination day onwards could perpetually delay the election. You're thinking that with 849 candidates for the lower house in 2010 you could delay the election a further 849 days making it five years, two-hundred and seventeen days between an election, and that by then more candidates might have signed up, leading to a perpetual suspension of the legislative and executive branches of the Australian Government. You're thinking of laughing manically, building a secret lair under a volcano and hiring expendable henchmen.

Well, no, you can't. For one thing it's actually illegal to kill 849 people to delay a federal election. For another, subsection (2) prevents this. Twice. Lets say, hypothetically, that the date of nomination prescribed in the writs is a Monday. And let's assume, just for the sake of it, that the day after that is a Friday. Yes, its unnecessarily complicated and chronologically nonsensical, but what the heck. If a candidate dies before midday Monday, the deadline for nominations is delayed 24 hours until Friday.

Now, if someone dies before midday Friday, the nomination date is not pushed back another 24 hours to, lets say, Tuesday. There are two reasons for this. Firstly, this only applies if the candidate dies "before 12 o'clock noon on the day fixed by the writ".

Secondly, even if the second death did somehow enact the delay, the extension is worded to continue until "the day next succeeding the day so fixed" (i.e. the day after Monday (i.e. Friday)). It doesn't matter how many times the extension is applied, the delay only lasts until the day after the day fixed in the writs (which is the Friday (the day after the Monday) and not the Tuesday (the day after that))!
Now I have an urge to write coverage for the election of the President of the Supreme Council of Gallifrey and All Her Dominions...

Rightly Written Writs:

A writ is simply a formal order. In the case of a writ of election, it is the piece of paper that creates the election as a legal entity. In practical terms, this is the real calling of an election, and each writ will contain the dates for:
  • The the close of the rolls (i.e. the last date to enrole to vote) which is always 7 days after the writ (CEA s.115),
  • The nomination (i.e. the last day to put your name forward as a candidate) as outlined above,
  • The polling (i.e. the vote itself) which must be a Saturday (CEA s.158) 23 to 31 days after the nomination (CEA s.157)
  • The return of the writ (the date when the writ must be returned, effectively the end of the election) within 100 days of the writ (CEA s.159) which allows for 41 days after the election (including the 24 hour delay caused by the death of a nominee) during which to determine who won each seat and attach their names to the writ.
A writ takes effect from 6 PM on the day it is issued, and is issued by the Governor-General. The Governor-General has traditionally issued writs at the request and advice of the Prime Minister, although this is not a legal requirement and the writs could be issued today if the GG so desired. It is a bit misleading to say the PM calls an election, although the media will often report this as such.

One writ must be issued for each of the current states and territories. In the CEA, Section 154 they are each named specifically, which means if a new state or territory is added to the Commonwealth (as is allowed in the Constitution, Section 121) and the CEA is not updated, that state/territory will not get a vote. (Editor: This is probably to deal with cases like Norfolk Island.)

In the case of a general election (what I casually refer to as a federal election) all electoral divisions must be elected on the same day and the writs must all be returned by the same deadline (CEA s.160). (In the case of a by-election, writs can be issued for individual electorates or groups of electorates, and as such may have individual polling and return of writ dates.)
 

The Thing Upstairs:

The Senate, of course, does things differently. When do they ever not?

Each state's senators have their elections run on a different timetable to the lower house, and do not need to coincide with the lower house elections (although for simplicity they regularly do). Senators serve a 6-year term, and half are replaced every three years. A senator's term begins on July 1, and the election for that senate seat must be held in the year preceding the seat becoming vacant, ready for immediate switch over. All of this is laid out in Section 13 of the Constitution.

Writs for senate seats in each state are issued not by the Governor General, but by that state's Governor, according to Section 12 of the Constitution. Section 151 of the Commonwealth Electoral Act of 1918, however, states that the Governor-General will issue the writs for territories, and that these are tied to the lower house election.

Further, the Governor-General can dissolve the entire Senate, for example in a double dissolution as allowed under Section 57 of the Constitution, and each state must issue writs for their senators within ten days of this being announced under Section 12.

That all complicates things, so its a good job the Governors-General and state Governors tend to work so well together. A lot of this is a relic of federation, where individual states were concerned about losing their autonomy. In practice, the Governors tend to lump the Senate elections in with the House of Representatives where allowed by the timetables set out by the Constitution. 

Those who advocate fixed term elections (thus preventing politicians from "calling" an early election when they are most popular, or delaying when they are least) would generally advocate for a much simpler system where all federal senate seats are tied to House of Reps elections. But until then, politicians won't be "calling" elections at all, and the Senate will do as the State Governors direct.