It’s a new year (or at least a year partially consumed but previously unexposed to the prognostications of this blog), and any responsible author would have set aside time to address the results of several outstanding analyses from the previous twelve months.
Instead, this publication rests entirely on my time-poor and scatterbrained mind to lumber ever forwards, so here we are, less than a week from the South Australian elections, and I have emerged to once again throw a prediction onto the ever-growing pile for future me to reassess at some unspecified and greatly belated juncture.
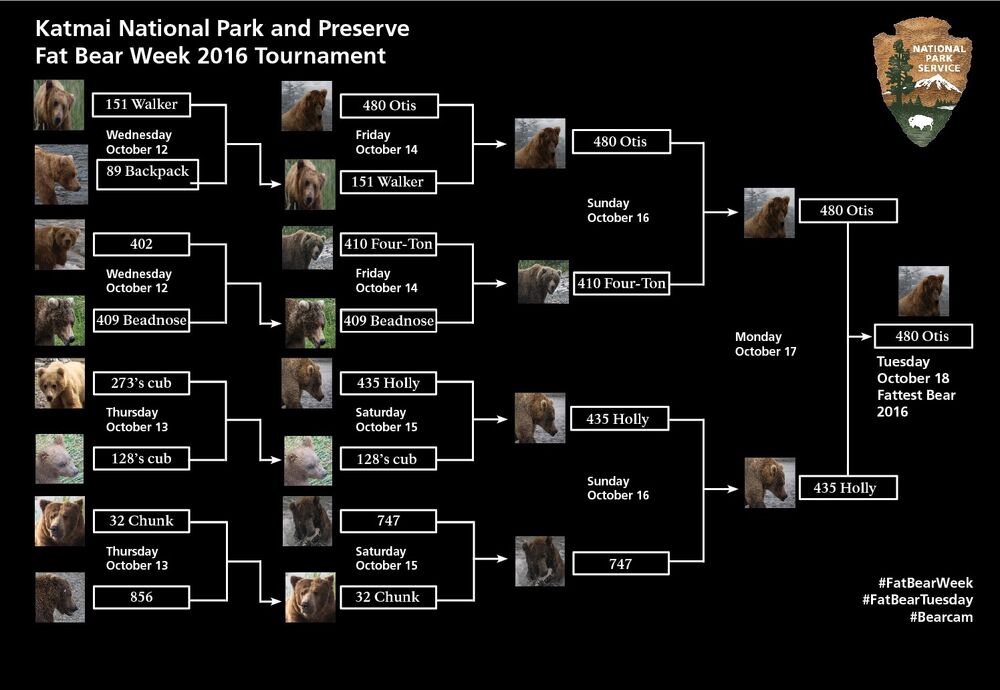
Fortunately (with the exception of perfectly calling the 2021 Fat Bear Week winner), the analysis has always come back the same: not a bad prediction, but I would do better to stick to applying the swing to the pendulum and calling it a day. All my attempts at a more nuanced analysis raise the complexity while reducing the accuracy of my guesses. So instead, this time, we’re trying something different: using the swing-and-pendulum to predict the final results, then reverse engineering the map to work out which seats will fall which way to give us that outcome.
Conclusion
The current distribution of seats and their pendulum positions (adjusted following redistribution of boundaries) were taken from here. The swing is derived by taking the difference between the 2018 two party preferred election results election results (Liberal 52%, Labor 48%) and the latest polling provided on the ever reliable Wikipedia (Liberal 47%, Labor 53%) for a swing of 5 percentage points towards the ALP (or -5 to the government).
Applying a net swing of -5 to all electorates evenly indicates a loss of 3 seats for the Liberals (Adelaide, Elder and King). This is hardly dramatic, but from one seat majority with 24 of the state’s 47 seats in the Legislative Assembly this would at the very least put them into minority government and realistically into opposition.
| ELECTORATE | PENDULUM | RESULT | ||
| Adelaide | Lib | 1.0 | ALP | -4.0 |
| Badcoe | ALP | -5.2 | ALP | -10.2 |
| Black | Lib | 9.4 | Lib | 4.4 |
| Bragg | Lib | 17.8 | Lib | 12.8 |
| Chaffey | Lib | 18.0 | Lib | 13.0 |
| Cheltenham | ALP | -16.2 | ALP | -21.2 |
| Colton | Lib | 6.1 | Lib | 1.1 |
| Croydon | ALP | -23.3 | ALP | -28.3 |
| Davenport | Lib | 8.0 | Lib | 3.0 |
| Dunstan | Lib | 7.1 | Lib | 2.1 |
| Elder | Lib | 2.1 | ALP | -2.9 |
| Elizabeth | ALP | -17.2 | ALP | -22.2 |
| Enfield | ALP | -6.4 | ALP | -11.4 |
| Finniss | Lib | 14.4 | Lib | 9.4 |
| Flinders | Lib | 26.8 | Lib | 21.8 |
| Florey | Ind | N/A | N/A | |
| Frome | Ind | N/A | N/A | |
| Gibson | Lib | 9.8 | Lib | 4.8 |
| Giles | ALP | -14.1 | ALP | -19.1 |
| Hammond | Lib | 16.8 | Lib | 11.8 |
| Hartley | Lib | 6.5 | Lib | 1.5 |
| Heysen | Lib | 7.5 | Lib | 2.5 |
| Hurtle Vale | ALP | -8.3 | ALP | -13.3 |
| Kaurna | ALP | -16.2 | ALP | -21.2 |
| Kavel | Ind | 14.6 | Lib | 9.6 |
| King | Lib | 0.7 | ALP | -4.3 |
| Lee | ALP | -5.2 | ALP | -10.2 |
| Light | ALP | -7.6 | ALP | -12.6 |
| MacKillop | Lib | 25.3 | Lib | 20.3 |
| Mawson | ALP | -0.7 | ALP | -5.7 |
| Morialta | Lib | 9.7 | Lib | 4.7 |
| Morphett | Lib | 11.6 | Lib | 6.6 |
| Mount Gambier | Ind | N/A | N/A | |
| Narungga | Ind | 18.2 | Lib | 13.2 |
| Newland | Lib | -0.3 | ALP | -5.3 |
| Playford | ALP | -19.0 | ALP | -24.0 |
| Port Adelaide | ALP | -16.8 | ALP | -21.8 |
| Ramsay | ALP | -18.6 | ALP | -23.6 |
| Reynell | ALP | -9.4 | ALP | -14.4 |
| Schubert | Lib | 14.9 | Lib | 9.9 |
| Stuart | Lib | N/A | N/A | |
| Taylor | ALP | -12.2 | ALP | -17.2 |
| Torrens | ALP | -5.6 | ALP | -10.6 |
| Unley | Lib | 11.2 | Lib | 6.2 |
| Waite | Ind | 7.3 | Lib | 2.3 |
| West Torrens | ALP | -14.3 | ALP | -19.3 |
| Wright | ALP | -3.1 | ALP | -8.1 |
Let us take that as our result and work backwards to figure out which seats are likely to be won or lost.
Method
In general usage, a pendulum margin of less than 6 percentage points is considered “marginal”, with more than that being “fairly safe” or better. In the absence of any better measure, let us assume that all electorates where the above calculation left an electorate within 6 points of of flipping are still up for play, and that the others will fall as suggested.
| ELECTORATE | PENDULUM | RESULT | ||
| Adelaide | Lib | 1.0 | ||
| Badcoe | ALP | -5.2 | ALP | -10.2 |
| Black | Lib | 9.4 | ||
| Bragg | Lib | 17.8 | Lib | 12.8 |
| Chaffey | Lib | 18.0 | Lib | 13.0 |
| Cheltenham | ALP | -16.2 | ALP | -21.2 |
| Colton | Lib | 6.1 | ||
| Croydon | ALP | -23.3 | ALP | -28.3 |
| Davenport | Lib | 8.0 | ||
| Dunstan | Lib | 7.1 | ||
| Elder | Lib | 2.1 | ||
| Elizabeth | ALP | -17.2 | ALP | -22.2 |
| Enfield | ALP | -6.4 | ALP | -11.4 |
| Finniss | Lib | 14.4 | Lib | 9.4 |
| Flinders | Lib | 26.8 | Lib | 21.8 |
| Florey | Ind | N/A | ||
| Frome | Ind | N/A | ||
| Gibson | Lib | 9.8 | ||
| Giles | ALP | -14.1 | ALP | -19.1 |
| Hammond | Lib | 16.8 | Lib | 11.8 |
| Hartley | Lib | 6.5 | ||
| Heysen | Lib | 7.5 | ||
| Hurtle Vale | ALP | -8.3 | ALP | -13.3 |
| Kaurna | ALP | -16.2 | ALP | -21.2 |
| Kavel | Ind | 14.6 | Lib | 9.6 |
| King | Lib | 0.7 | ||
| Lee | ALP | -5.2 | ALP | -10.2 |
| Light | ALP | -7.6 | ALP | -12.6 |
| MacKillop | Lib | 25.3 | Lib | 20.3 |
| Mawson | ALP | -0.7 | ||
| Morialta | Lib | 9.7 | ||
| Morphett | Lib | 11.6 | Lib | 6.6 |
| Mount Gambier | Ind | N/A | ||
| Narungga | Ind | 18.2 | Lib | 13.2 |
| Newland | Lib | -0.3 | ||
| Playford | ALP | -19.0 | ALP | -24.0 |
| Port Adelaide | ALP | -16.8 | ALP | -21.8 |
| Ramsay | ALP | -18.6 | ALP | -23.6 |
| Reynell | ALP | -9.4 | ALP | -14.4 |
| Schubert | Lib | 14.9 | Lib | 9.9 |
| Stuart | Lib | N/A | ||
| Taylor | ALP | -12.2 | ALP | -17.2 |
| Torrens | ALP | -5.6 | ALP | -10.6 |
| Unley | Lib | 11.2 | Lib | 6.2 |
| Waite | Ind | 7.3 | ||
| West Torrens | ALP | -14.3 | ALP | -19.3 |
| Wright | ALP | -3.1 | ALP | -8.1 |
A couple of quick observations: Firstly, there are some strange things going on in the above tables. Newland has a Liberal incumbent but is nominally Labor following boundary changes. For reasons we'll get into later Newland gets even more complicated and won't be predicted for either by the end of this process. Stuart also has a Liberal incumbent but is not measured as such in the Pendulum as boundary changes have imported an Independent who is incumbent in Frome (and thus Frome has the converse situation where it is held by an Incumbent but is measured as a Liberal seat by the pendulum). This plays a particular kind of havoc with 2PP calculations I usually rely on so both are excluded from 2PP analysis in my tables. Kavel, Narungga and Waite were won by Liberals in 2018 and are measured as Liberal seats in the pendulum, but are currently held by independents who left the Liberal party putting them into minority government.
Secondly, as the swing is -5 and any result between 6 and -6 is up for play, every seat predicted to change hands by the pendulum is still in play. This feels right at this stage, as these narrow seats are probably the most likely to buck general trends for a number of reasons (focus of campaign resources and sandbagging, larger comfort with protest voting in safe seats etc.) However, this method could be applied where swings of more than 6 percentage points occur with the potential to “guarantee” a change of seat in some electorates at this early stage. Whether or not this is appropriate requires further analysis than I will go into here.
Thirdly, of the 14 “in play” seats, only (Mawson and nominally
Newland) are considered to be currently Labor. I have excluded Florey, Frome,
Mount Gambier and Stuart from this number, simply because they cannot be assessed
easily through 2PP data. This doesn’t leave the Liberals with much space to gain,
so this is already a very promising result for Labor. On the other hand, as we
are taking the pendulum result of Lib 20, ALP 23 (and four electorates with 3 independents doing
their own things) the change of government is virtually a built-in assumption
at this point. The real question is which five of the 14 seats still in play do
we assign to Labor--and do these replace or confirm Adelaide, Elder, King, Mawson and
Newland? (Ah, but I've already hinted that Newland won't nake Labor's final cut!)
Components
Some progress can be made by process of elimination factoring the history and nature of the seats. Davenport has been some form of Liberal since it was founded in the 1970s. So has Heysen, barring the 8 years it was abolished. Morialta is the updated name of Coles, which with one exception in 2006 has been consistently won by the Liberals. And when its members don’t defect to the crossbench (2014 and 2020) Waite is another reliable Liberal seat and has been since its creation in 1993 (and before this as Mitcham at least as far back as 1982 and arguably with a short interregnum from the Democrats as far back as 1938).
Dunstan is a relatively new seat that hasn't yet had a change of MP, but it is effectively identical to the electorate of Norwood which it replaced in 2014. Norwood does have a mixed history with long-serving Liberal and Labor members; however the electorate's current MP is SA Premier Steven Marshall and while it is not unheard of for leaders to lose their seat it is rather rare, with name recognition and proximity to decision making power making it tough to budge the needle.
On the other hand, Colton is South Australia’s strongest bellwether seat—the party that has won the election has won Colton every year since it was founded in 1993. While pundits often read too much into bellwethers generally, they have a proven ability to swing consistently with public opinion, perhaps as seats with highly representative populations. The trend, of course, is to treat the bellwether as an indicator of who will win the election; here I propose the reverse—on the assumption that Labor will form government, Colton is likely to be one of their gains. This is contrary to the pendulum which with a 6.1 margin is outside the expected 5-point swing.
Everywhere else is a bit of a mess, so in alphabetical order:
Adelaide is an old (1902) seat with an extensive but
complicated Labor history. On the other hand, when Liberals hold it, they hold
it for over a decade with Michael Armitage (1989-2002) and now Rachel Sanderson
(2010 onwards). Perhaps it is time once more for Labor to take back the reigns? This is the closest seat to a toss-up in my view.
Black has only been around for one election. It is considered to replace Mitchell with a rainbow of previous candidates (largely due to Kris Hanna serving Labor, then Greens, then as an independent all between 1997 and 2010). However, when Black was founded it also inherited a number of voters from Bright and its incumbent David Spiers while Mitchel’s incumbent went to Gibson. Overall, Mitchel more often voted Labor when the Liberals won than vice versa suggesting a historical leaning to Labor, but the opposite is true of Bright. It the absence of more illuminating data I assume the incumbency of David Spiers will carry this one for the Libs.
Since its creation in 1993 Elder has only voted against the winning party once, in 1993 and in favour of Labor. If we can call Colton for Labor, we can do the same for Elder.
Gibson is considered “safe” for the Liberals with a 10% margin, but to accept that is to undermine the process used here to identify the risky seats. It has only been around for one election and before that theoretically replaced mildly Liberal Bright but also took in voters from mildly ALP-leaning Elder and Mitchel as well as long-term Liberal stronghold Morphett. How these groups have merged may be reflected in the strong Liberal victory here in 2018, or it may just be a particularly volatile seat. Purely because we need to fill more Liberal slots than Labor, I’m setting this as a Lib seat.
Hartley is a highly variable seat that should be a close contest. There’s not much decisive data to work with, but there are more Liberal slots to fill than Labor, so for now Hartley is tipped to stay blue.
To quote Wikipedia “The Electoral District Boundaries Commission considered that it had renamed the electoral district of Napier to King, but only 1479 of the estimated 27,002 voters in King had previously been voters in Napier... The majority of voters in King came from Wright…” Both Napier and Wright would be considered Labor seats generally, yet when King was formed last election, it was won by a narrow margin for the Libs. I’m going to take a chance that this was an outlier after 12 years of Labor government and not reflective of the seat’s natural tendency. Therefore, I’m calling this for Labor.
Mawson is the one seat worth a second look with a Labor incumbent. Mawson has been ALP for the last 16 years under Leon Bignell who is running again. His predecessor was Liberal with a run almost equally impressive at 13 years. Despite this it’s probably fair to call this a Labor seat generally with only one other Liberal serving a single term since the seat was formed in 1970. More importantly, it looks like Mawson doesn’t like switching things up too often. Therefore, Mawson becomes our 5th and final ALP call to round out the 23 ALP seats predicted by the pendulum.
That is contrary to the pendulum-and-swing prediction for Newland, which is already nominally Labor following redistribution and the most marginal seat the Liberals have. The seat has also absorbed long-running Independent Frances Bedford from Florey so for now I’m preserving it as un-called.
| ELECTORATE | INCUMBENT | PENDULUM | 5% SWING | PREDICTION |
| Adelaide | Lib | Lib | ALP | ALP |
| Badcoe | ALP | ALP | ALP | ALP |
| Black | Lib | Lib | Lib | Lib |
| Bragg | Lib | Lib | Lib | Lib |
| Chaffey | Lib | Lib | Lib | Lib |
| Cheltenham | ALP | ALP | ALP | ALP |
| Colton | Lib | Lib | Lib | ALP |
| Croydon | ALP | ALP | ALP | ALP |
| Davenport | Lib | Lib | Lib | Lib |
| Dunstan | Lib | Lib | Lib | Lib |
| Elder | Lib | Lib | ALP | ALP |
| Elizabeth | ALP | ALP | ALP | ALP |
| Enfield | ALP | ALP | ALP | ALP |
| Finniss | Lib | Lib | Lib | Lib |
| Flinders | Lib | Lib | Lib | Lib |
| Florey | Ind | Ind | N/A | |
| Frome | Ind | Lib | N/A | |
| Gibson | Lib | Lib | Lib | Lib |
| Giles | ALP | ALP | ALP | ALP |
| Hammond | Lib | Lib | Lib | Lib |
| Hartley | Lib | Lib | Lib | Lib |
| Heysen | Lib | Lib | Lib | Lib |
| Hurtle Vale | ALP | ALP | ALP | ALP |
| Kaurna | ALP | ALP | ALP | ALP |
| Kavel | Ind | Lib | Lib | Lib |
| King | Lib | Lib | ALP | ALP |
| Lee | ALP | ALP | ALP | ALP |
| Light | ALP | ALP | ALP | ALP |
| MacKillop | Lib | Lib | Lib | Lib |
| Mawson | ALP | ALP | ALP | ALP |
| Morialta | Lib | Lib | Lib | Lib |
| Morphett | Lib | Lib | Lib | Lib |
| Mount Gambier | Ind | Ind | N/A | |
| Narungga | Ind | Lib | Lib | Lib |
| Newland | Lib | ALP | ALP | |
| Playford | ALP | ALP | ALP | ALP |
| Port Adelaide | ALP | ALP | ALP | ALP |
| Ramsay | ALP | ALP | ALP | ALP |
| Reynell | ALP | ALP | ALP | ALP |
| Schubert | Lib | Lib | Lib | Lib |
| Stuart | Lib | Ind | N/A | |
| Taylor | ALP | ALP | ALP | ALP |
| Torrens | ALP | ALP | ALP | ALP |
| Unley | Lib | Lib | Lib | Lib |
| Waite | Ind | Lib | Lib | Lib |
| West Torrens | ALP | ALP | ALP | ALP |
| Wright | ALP | ALP | ALP | ALP |
This also still leaves the independent-affected seats of Florey, Frome, Mount Gambier and Stuart. As mentioned, Florey’s independent incumbent since 1997, Frances Bedford, is now running elsewhere. The pendulum still shows the seat as independent with a 1.9% margin against the ALP. Unless all of Ms Bedford’s voters fall back to the Liberals (and in 2019 a number of these seem to have come from the Greens to push her ahead of the Libs so this is very unlikely) this should be an easy with for the ALP.
Similarly, Frome’s independent Geoff Brock has transferred to Stuart so where the Liberals were once trailing, they will now be the dominant power—on primary votes last election the Liberals picked up 38% while the ALP took 10%.
These results require a small deviation from the method we’ve
used so far, with 24 seats now called for Labor when the pendulum required Lib 20,
ALP 23. This is because we had 4 (now 5) seats excluded for the complexities of
independents, when there are only three independents we’re considering (Bedford
in Florey/Newland, Brock in Frome/Stuart and Mount Gambier’s Troy Bell). Some manipulation
of the numbers is inevitable; if I were to switch Adelaide to Lib, for example, we would then have to many of those.
Troy Bell, at 39% of the primary vote, out-polled both Labor (10%) and the Liberals (24%) as an independent. Unless Mount Gambier is seeing some significant swing not detected anywhere else, we can expect him to hold his seat. The redistributions that moved Brock and Bedford into new seats are also some of their strongest supporters, but both have the challenge of building recognition and support from new constituents. Still, with their experience and existing supporter base this is not an impossible task and indeed there seems to be an apatite in Australia generally for a viable alternative to the major parties. With nothing more than a gut feeling and a desire not to distort this post’s trial of a new method too much I’m going to predict all three independents will return, but for me that really will be the interesting part to watch on Saturday.
Hypothesis
This completes the prediction. The table below shows (1) the incumbent as they currently identify, (2) the party holding the seat as assumed by the pendulum (e.g. Liberal-defecting crossbenchers will be replaced with new liberal faces and there are some nominal changes based on redistributions), (3) the results we would get by applying a uniform 5% swing which I will one day test my guesses against and (4) the final prediction.
| ELECTORATE | INCUMBENT | PENDULUM | 5% SWING | PREDICTION |
| Adelaide | Lib | Lib | ALP | ALP |
| Badcoe | ALP | ALP | ALP | ALP |
| Black | Lib | Lib | Lib | Lib |
| Bragg | Lib | Lib | Lib | Lib |
| Chaffey | Lib | Lib | Lib | Lib |
| Cheltenham | ALP | ALP | ALP | ALP |
| Colton | Lib | Lib | Lib | ALP |
| Croydon | ALP | ALP | ALP | ALP |
| Davenport | Lib | Lib | Lib | Lib |
| Dunstan | Lib | Lib | Lib | Lib |
| Elder | Lib | Lib | ALP | ALP |
| Elizabeth | ALP | ALP | ALP | ALP |
| Enfield | ALP | ALP | ALP | ALP |
| Finniss | Lib | Lib | Lib | Lib |
| Flinders | Lib | Lib | Lib | Lib |
| Florey | Ind | Ind | N/A | ALP |
| Frome | Ind | Lib | N/A | Lib |
| Gibson | Lib | Lib | Lib | Lib |
| Giles | ALP | ALP | ALP | ALP |
| Hammond | Lib | Lib | Lib | Lib |
| Hartley | Lib | Lib | Lib | Lib |
| Heysen | Lib | Lib | Lib | Lib |
| Hurtle Vale | ALP | ALP | ALP | ALP |
| Kaurna | ALP | ALP | ALP | ALP |
| Kavel | Ind | Lib | Lib | Lib |
| King | Lib | Lib | ALP | ALP |
| Lee | ALP | ALP | ALP | ALP |
| Light | ALP | ALP | ALP | ALP |
| MacKillop | Lib | Lib | Lib | Lib |
| Mawson | ALP | ALP | ALP | ALP |
| Morialta | Lib | Lib | Lib | Lib |
| Morphett | Lib | Lib | Lib | Lib |
| Mount Gambier | Ind | Ind | N/A | Ind |
| Narungga | Ind | Lib | Lib | Lib |
| Newland | Lib | ALP | ALP | Ind |
| Playford | ALP | ALP | ALP | ALP |
| Port Adelaide | ALP | ALP | ALP | ALP |
| Ramsay | ALP | ALP | ALP | ALP |
| Reynell | ALP | ALP | ALP | ALP |
| Schubert | Lib | Lib | Lib | Lib |
| Stuart | Lib | Ind | N/A | Ind |
| Taylor | ALP | ALP | ALP | ALP |
| Torrens | ALP | ALP | ALP | ALP |
| Unley | Lib | Lib | Lib | Lib |
| Waite | Ind | Lib | Lib | Lib |
| West Torrens | ALP | ALP | ALP | ALP |
| Wright | ALP | ALP | ALP | ALP |
That’s Liberal 20 seats, Labor 24 and a 3-seat crossbench. This would give Labor a 1-seat majority and put them in power after a single term in opposition.