Saturday, 18 May 2013

Money Money Money

Responsible Spending:


It should not come as a great surprise to anyone that we will be turning our attention to the economic situation in a week when the budget was released and the opposition budget reply naturally followed. This was also a week that saw France officially describe its financial situation using the R-Word and Gina Rinehart once again bemoaned the state of Australia’s finances, despite having enough money to personally bail out a small nation (or at least share with her children). Tony Abbott described a Budget Emergency this week. We recently dropped below parity with the $USD. Bill Gates is once more the richest person in the world. It seems fitting to summarise the entire economic world with a phrase from the master of the dramatic arts: “it is a tale told by an idiot, full of sound and fury, signifying nothing.”

I have written previously that I shall restrict myself to analysis and interpretation, not opinion. This is a little inaccurate if you take into account my admittedly subjective tirade against the current incarnation of our compulsory voting system. However I do strive to be nonpartisan and to rely on evidence wherever possible – within the loose shackles of a light, entertaining and occasionally jocular blog format. For this reason I will not be critiquing the contents of the budget or the Coalition’s reply. And, of course, factoring in the effect of the budget on the predicted voting patterns of the public can never be more than pure speculation, even with accurate and targeted polling data. I will, however, be looking at what the budgets can tell us about the strategy of both major parties for the upcoming election and how this may influence our election predictions.

This week we saw an austere and “responsible” plan from both [sic] sides. Responsible spending is one of those great political terms that seem to cluster around economics and finance, like “eliminating waste”. It is a great term because it is both simple and evocative. It is a great term because it is something every household can relate to. It is a great term because it automatically implies that your opponents are economically incompetent, and because it questions both the funding and necessity of their policies in general without calling on specifics. And it is a great term because it is something every Australian voter can agree to oppose in principle; who could possibly support irresponsible spending?

But most of all, from a political point of view at least, it is a great term because it can mean absolutely anything and therefore binds you to absolutely nothing. Normally it implies reduced spending – especially in the current economic climate – but this is not necessarily the only interpretation. Responsible spending can range from winding back funding to ‘unnecessary’ projects to throwing truckloads of cash at policies where it is ‘cheaper to fix the problem now than deal with it later’. It can mean not wastefully over funding schemes that could succeed on much smaller budgets, or it can mean providing enough resources to ensure targets are reached and previous investments were not wasted. One could argue that additional funding for childcare would be irresponsible if the budget were particularly strained. Conversely one could argue that any investment to allow many parents – particularly single parents – to get back to work, earn a decent salary and pay more income tax is necessary to boost government coffers.

Effectively, responsible spending means funding the initiatives a party considers important, and cutting funding to those it opposes or simply considers ineffective. It means funding the policies they support, and not those that they oppose. It is stating the blatantly obvious, while making the other side look bad – and you don’t even have to make any new commitments.

Responsible spending is always a defensive position, a reaction to both the economic circumstances at home and abroad as well as the policies of others. After the aggressive and disenchanting election of 2010 where Labor and the Coalition both went on the offensive, it is interesting to see both [sic] sides of politics playing such a defensive game this year.

Both the ALP and the Coalition have proposed very similar plans with an emphasis on reducing spending – responsibly, of course – and delivering a budget surplus. The Coalition has to prove they can deliver a surplus because that is what the Liberal Party has been promising for quite some time now. The Labor Party needs to prove they can deliver a surplus because that is what the Liberal Party has been promising for quite some time now. However there is an argument to be made that a healthy economy is a means to an end, and not an end in itself. Having some money left over is useful in the event of a crisis. On the other hand, it is a bit redundant if, in order to obtain that surplus, the government needs to expose the nation to a crisis by cutting funding to education, health, defence and other vital services.

Normally a budget based on reducing spending is far more about perception and politics than about actual governance. Given the economic situation globally there is a genuine need to keep Australia in a position where we can avoid Eurozone-style recessions, so there is probably a mix of government and politics in this year’s budget. However, we are not experiencing the budget emergency Abbott suggests. Here is a graph representing debt among 19 of the G20 economies (the 20th economy is the European Union which is difficult to calculate and already includes several economies represented here).
 
Source for debt figures.

Now you can say that any debt is bad debt, but notice that all 19 of the most important economies in the world are in debt right now, because even bad debt is better than not being able to fund basic services. Australia’s 420-odd billion in debt does need to be paid back eventually, but it is insignificant compared to Japan or the USA, for example. Unemployment is at record lows and we have a triple A credit rating, both of which suggest we are in a good position to pay this debt back over the next decade or so. A more important factor is nominal GDP – the amount of money the country makes. This relates (through government revenue by taxation) to our ability to pay the money back. If debt is equal to nominal GDP then we are making as much each year as our debt. In other words if we put all of our profits towards paying off the debt it would take one year. Of course, we won’t put all of our profits towards that because most of that money stays in our pockets, and that which does go to the government also needs to be spent on important services that keep the country running. Nonetheless, a higher GDP puts us in better stead to pay back the debt.

In the next graph debt is still represented by the countries flags, which are now hoisted on flagpoles representing nominal GDP. The GDP can be measured against the scale on the Y axis, and the debt is to scale. The bottom of each banner, as a result, indicates on the Y axis’s scale the change each nation would get if it tried to pay off its debt with one years GDP. It’s the flag-to-flagpole ratio that illustrates how big the debt problem is. A small flag on a high mast is great news. A long banner on a short flagpole – I’m looking at you, Japan – is not so good. Compare our situation to, for example, Germany (the super-economy propping up most of Europe) or China (our local economic superpower) and decide for yourself how big Abbott’s budget emergency really is:

Source for debt figures; source for nominal GDP figures.

The Labor Budget:

During the WA election some of my predictions were thrown out by local spending, referred to by Coalition politicians as “sandbagging”. One of the lessons I took from that election was the importance of considering local issues – especially financial issues – in close-run seats. The following week I looked at the spending allocated to Western Sydney and we saw that Labor was not so much interested in winning seats here as they were in not losing them. I would like to do a similar, nationwide analysis of the budget spending.

One of my Archaeological colleagues recently suggested there are two types of voters – those who vote based on ideology and those who vote based on personal gain. I am not convinced that these are the only kinds of voters (e.g. there are people who vote based on perception and personalities). I am also not convinced that everyone falls neatly in one of these categories exclusively. Importantly, which type of voter someone is may depend on various demographic factors, so the budget spending’s effects might be downplayed or amplified in different seats depending on the average age, profession, education level etc. of the constituents. However, let us assume that all voters vote based purely on their own personal benefit from the budget. The question I then want to ask is ‘just who is Labor winning over, and who are they losing?’

Now obviously a 10 million dollar announcement will have less impact than a 10 billion dollar one, and all announcements will effect everybody to some extent (even if only through the non-funding of projects they would more directly benefit from). To simplify things, I am going to look at what I consider to be the top five announcements (as determined by the amount of media coverage, how much the ALP probably intends to trumpet the project and how much it costs) and then determine who are the people most likely to benefit or lose out as a result, and where they are most likely to live.*

Announcement 1: National Disability Insurance Scheme
The NDIS is a much celebrated scheme to ensure equal access to quality services for disabled people and an attempt to prevent as many cases ‘falling through the gaps’. The obvious group to be most affected by this are people living with disabilities.

 Source.

Announcement 2: Raising the Super Guarantee
With an ageing population, many are concerned for their retirement. Younger voters will see many more changes to superannuation before they retire, and probably have more immediate concerns. This policy is complex, with gains and losses. There is less government contribution to superfunds and less tax concessions for the rich but a higher tax-free threshold and raised old age pensions. I am using people around retirement age as the most likely affected group.
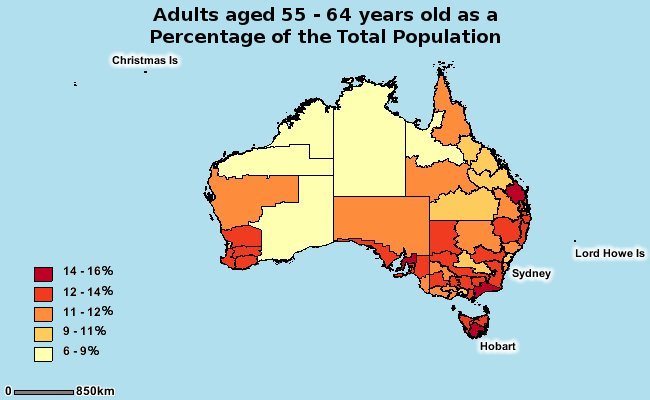
Source. 
This data is a little old, so many of the people represented here will have already retired. However, this is still probably a good approximation of near-retiring population distributions.
 
Announcement 3: Funding Reduction for Universities
One of the most publicised losers of this budget, the government is winding back promised funding for universities. To be precise, universities will not be losing money, but their funding will not increase by as much as it has been recently. The problem for universities are firstly that some have already decided how to spend the money they now won't be getting, and secondly that the increase in enrolments may mean less money per student. The further commercialisation of tertiary education will most likely result. This is not something I will get into here since I try to avoid expressing personal opinions, but it is an issue that many students understandably have strong feelings on.


Announcement 4: Funding Increase for Schools
Although not a 1 for 1 correlation, there has been a pairing of cuts to unis as "paying for" schools. In reality, of course, savings from the universities are added to the savings columns, expenses on schools added to the expenses columns and the totals are tallied. You could equally argue university wind backs are funding our military and it is the scrapped baby bonus that will fund education reforms.


However you wrap it up, it is obvious that there are far more children attending (compulsory) primary and secondary education (as well as childcare facilities and other institutions gaining a funding boost) than there are uni attendees. Arguing that the government is disadvantaging the few to benefit the many, along with the point that without a strong school system the universities will struggle anyhow, will no doubt be a common focus in the election campaign.

Announcement 5: Scrapping the Baby Bonus
This is a hard one to model since the census does not specifically record the number of pregnant women or couples trying for a child. This is also the most likely category to be skewed by the age of this data, since couples with a baby in 2006 may or may not have another in 2013. It does however suggest that these areas are populated by demographics likely to have children (young couples with financial security to start a family, areas with high teen-pregnancy rates etc.) which may well still be the case today.

The best I could do was model the population of children under four years of age.
 

Further analysis of these maps to follow...

* Unfortunately the 2011 Census is still being processed for cartographic applications, so the map data dates from 2006 and may be inaccurate. Maps are based on place of usual residence.

Friday, 10 May 2013

Long Posts and Small Fields

Small Fields:


One of the advantages of state elections from a reporter's point of view is that the number of voters is smaller, which means results are known sooner. With only three seats to count, this applies doubly in the TasLegCo.

My past predictive record is just above 90%. I only recorded 2 official predictions in the previous post:

  • Jim Wilkinson will retain Nelson
  • Vanessa Goodwin will retain Pembroke

You might expect us to get around 1.8 of those predictions right. The good news is that we got better than that, and so far have a 100% accuracy rating for Tasmanian state election predictions. This highlights the risk of working with small sample sizes, which I will no doubt end up doing at some point in the future of this blog. Meanwhile, our overall accuracy is at 90.3: up 0.2 percentage points.

I also made five unofficial predictions:
  • Leonie Hiscutt to win Montgomery
  • Cheryl Fuller to place second in Montgomery
  • Kevin Morgan to place last in Montgomery
  • Allison Ritchie to place second in Pembroke
  • Tom Baxter to place second in Nelson
Four of these were correct, including the first and most relevant prediction on that list. So had I gone out on a limb and predicted a Hiscutt victory, then I would have 100% off of three predictions (and raised our full record to 84/95 or 90.4%). However I was wary of that prediction and, as it turned out, rightly so.


Long Posts:


Normally I would skip over the correct predictions and focus on where I went wrong. As I didn't actually go wrong on any of the significant predictions, I'm going to look at why I was justified is playing cautiously with the Montgomery prediction.

Firstly, there was no reliable polling for Montgomery, so I was basing my results on generalisations and past results. Secondly, no-one in Montgomery had the kind of obvious advantage as in the other two seats. These combined make any prediction shaky to begin with. However, I set out my lengthy reasoning last week, beginning with the following lines:

I'm going to call Mr Morgan as the first to drop out, with most of his support flowing to Ms Fuller. The three way battle is hard to predict.

Four scenarios followed - two won by Mr Vincent, one by Ms Hiscutt and one tossup between Ms Hiscutt and Ms Fuller. None of these scenarios unfolded, because the one unofficial prediction I did not get right last week was that Mr Morgan would drop out first.

Ed Vincent polled the lowest, with only 9.73% of the primary vote (ignoring informal votes), presumably as he and Ms Hiscutt had a very similar voter base, and Ms Hiscutt got the bulk of them. This highlights the problems with first past the post polling that I have been discussing over the last few weeks; similarly placed candidates can undercut each other and let a less popular contender come out on top.

Tasmania, though, being a decently constructed system, is a preferential polling system. As such, Mr Vincent's supporters' votes were transferred to their next preferences. Surprisingly Ms Hiscutt received the least of these, while the most ideologically opposite candidate (Mr Morgan) received the most. This may represent a preference for Independents in the Legislative Council (the other independent, Ms Fuller, didn't do too badly out of the preferences.)

Whatever the reason, the fact remains that my predictions were based on a flawed premise. True, Ms Hiscutt was a strong contender either way. However, given that my predictive methodology went astray in the first round, it is understandable, I feel, that I was not confident enough to put my prediction for Montgomery outside the zone of a tossup.

Coming Up:

Tuesday next week is the second Tuesday in May, and therefore Budget Night. That may or may not steer my content for next week. We'll all have to wait and see.

Friday, 3 May 2013

Girt by Sea

Before I get to the main body of this post – and my next set of predictions – I should take this opportunity to reflect on my previous predictions. Counting has well and truly finished in WA now, and it turns out that the Shooters and Fishers party did not win the Mining and Pastoral seat they were in line for.

I noted that this may well happen in my review of that election, but I can now confirm that I did in fact get my predictions for the Mining and Pastoral region correct. This brings my accuracy rating up to 90.1% which is above my arbitrary "mediocre" threshold of 90% and below my "good" threshold of 95%.

TasLegCo:


Tasmania does elections differently to (and in many ways better than) the rest of us. I'm not going to go into Hare quota vs Droop/Hagenbach-Bischoff quotas here, but there are some other, less well known differences. For example, federally and in all other states (except Queensland*) the upper house is elected state-wide and the lower house is elected by electoral divisions or "seats". In Tasmania the lower house is elected state wide (which is why the Greens so regularly play such a big role - they garner enough support state-wide rather than out-muscling the Liberal and Labor candidates in an expensive seat-by-seat campaign). The upper house - or Legislative Council (or LegCo) - is therefore elected across seats.

Another difference is that ballots do not need to be fully filled in to be valid. You can always leave your last preference blank, and you never have to list more than your first three preferences. Also, a process called 'Robson rotation' is employed, where the candidate order is randomised between different ballots in the hopes of reducing the influence of the dreaded Donkey Vote.

Like other Legislative Councils and the Federal Senate (and other upper houses around the world, such as the U.S. Senate) candidates are not elected all at once. For example, in the Federal Senate, half of the senators are elected every three years (assuming the Senate is not overhauled by a double dissolution or the like) and serve for six-year terms as a result. In the U.S. one third (roughly) of the Senate is replaced every two years, again setting six year terms. This means there is continuity in the Senate – minimising the disruption of an election to ongoing processes – and ensures that the party makeup is more stable than the lower house, so a landslide in one election does not necessarily give one party both houses.

The Tasmanian LegCo has six year terms as well, but there is a LegCo election every year. The numbers of councillors has changed a fair bit in recent years, but the current system has three seats up for election in odd numbered years and two in even numbered years for a total of 15 seats. (One previous incarnation had 18 seats, and thus three seats up for election every year.)

Being an odd numbered year, three seats are up for election on Saturday: Montgomery, Nelson and Pembroke.

Because the state of Tasmania is divided into seats for the upper house elections, is is not uncommon for safe seats to emerge, and incumbency is reasonably stable. In most cases you expect the same person to be re-elected. Interestingly, only two upper house members are party affiliated - one Liberal and one ALP. One of these is up for re-election.

There is little valid polling available for the LegCo. Many seats are not contested by all major parties (Labor is not officially contesting any this year). When seats are contested, the major parties do not necessarily do well. This means margins and predicted swings - the bread and butter of the psephologists predictive sandwich - are not applicable. Instead, we're going on past voting trends (but without me having the time to put together any variable-dependent transparency arrays...) and other, less reliable factors. This round of predictions is going to be a bit rough as a result.

Nelson:

Incumbent: Jim Wilkinson (Indepenent)

Mr Wilkinson was elected for the seat of Queenborough in '95. In the 1998-99 redistribution caused by the above mentioned alterations to LegCo seats, he was shifted to the newly created seat of Nelson. Wilkinson won the 2001 elections with 48.99% of the primary vote in a 4-way contest, almost double his nearest competitor. In 2007 he won again with 61.60% of the vote in a two-way race against a Greens candidate. Boundary redistribution since then has removed some of the strongest Greens sections from this seat.

Mr Wilkinson will be running against three other candidates on Saturday. Two are independents unlikely to garner enough support to topple the current MLC. The third is a Greens candidate which is likely to be Mr Wilkinson's main competitor. However, given Mr Wilkinson's comfortable victory over the Greens in 2007 and the subsequent redistribution, the incumbent is in a strong position.

Prediction: Jim Wilkinson Returned

Pembroke:

Incumbent: Vanessa Goodwin (Liberal Party)

Ms Goodwin is the only Liberal party member in the LegCo, and one of two party affiliated MLCs (the other being Labor's Craig Farrell in the Seat of Derwent, up for election in 2015). After the withdrawal of Labor-associated Allison Ritchie - an active advocate for women in politics and the youngest person ever elected to the Tasmanian LegCo - Ms Goodwin won the 2009 by-election. In this eight-way contest she collected 38.55% of the primary vote - more than three times her nearest competitor (and the only other party affiliated candidate, who stood for the Greens).

Ms Goodwin faces two contestants on Saturday - the Greens candidate she beat in 2009 and Allison Ritchie, who is running again. General opinion supports Ms Goodwin, however Ms Ritchie may yet benefit from her 2001** and 2007*** victories to get her message out and is likely to be the main competitor.

With the exception of Ms Ritchie, however, Pembroke has been repeatedly strong performer for Liberal or Liberal-leaning politicians. I suspect this trend is the reason for the socially conservative campaigns run be all candidates (even the Greens candidate suggesting moderation to her own party's proposed abortion bill).

Prediction: Vanessa Goodwin Returned

Montgomery:

Incumbent: Sue Smith (Independent)

Ms Smith actually began as the Councillor for Leven after the 1997 election. She was shifted into the newly formed seat of Montgomery when it was created in the same redistribution as Nelson. She won the seat in 2002 with 51.71% of the primary vote in a 4-way contest - more than twice the votes of her nearest competitor - and again in 2007 where she was unopposed. From 2003 until 2005 she was President of the Commonwealth Parliamentary Association and in 2008 she became President of the Tasmanian Legislative Council.

Normally this would be a classic example of an incumbent that would be nearly impossible to dislodge. However, I am predicting that Ms Smith will not hold her seat because of one specific factor: she is retiring.

Because it is so hard to remove a sitting MLC, an opening like this attracts a lot of speculation and a few more candidates than normal. This will be the main seat to watch, hence I will go into more detail than for Nelson or Pembroke.

Montgomery, like much of Tasmania's northwest coast, is rather conservative. Liberal candidates would be expected to outperform Labor or Greens, especially in the current federal political climate. There are, however, no Labor or Greens candidates in Montgomery, so in the absence of polling it becomes a question of who the "others" are.

Candidate 1: Kevin Morgan (Independent) has past links to Labor. He has made a campaign around the insistence of his independence – which is probably necessary to give him any real chance, yet also distracts from getting any policy across. When he does get down to his guiding values (paragraph 13 of this media release provided on his website) he admits:

"I do have Labor values in equality and social justice, I strongly support Education, Health and Law Enforcement and believe that all these systems must be sustainably supported and run efficiently to attain high levels of service to the state and the community."
I suspect he's the right candidate in the wrong seat, and expect him to place last.

Candidate 2: Leonie Hiscutt (Liberal) is the only officially party-endorsed candidate in this race, and playing the exact opposite strategy. Although the prevalence of independents in the LegCo is generally believed to be the result of conservative voters preferring conservative independents to Lib/Nat coalition members (and non-conservative voters supporting non-conservative independents over Labor or the Greens) Ms Hiscutt is flying the Liberal flag high.

This certainly allows her to bring in more political muscle (although there is a $14,000 funding cap for campaigns in Tasmania, so she won't be dipping into a bottomless Liberal Party slushfund). This political muscle is evidenced by her updates on her campaign Facebook page (which, according to ABC is her main election website). Her formulaic short-post-and-a-photo updates are punctuated by such distractions as:
"My baby was playing for the Two Blues today at Penguin for the seconds. They won by one point!"
Or:
"I am just opening the mail and have come across a letter from the Fox Baiting Task force. The letter tells me where the baits have been laid in our area. Would you believe the name of the Operations Manager of the Fox Eradication Branch is Nick Bates!!"
Feigned folksy amateurism, or the result of cost-cutting at every turn? Ms Hiscutt was the Liberal candidate for Braddon at the 2010 Tasmanian Election, and may be missing her $20,000 warchest.

Candidate 3: Ed Vincent (Independent) is a former Liberal candidate, differing from Ms Hiscutt chiefly on the Forestry legislation. Competing for similar voters, Mr Vincent will chip away some of Ms Hiscutt's support; the question is "how much?"

The "forest peace deal" is broadly opposed by Liberal voters in the only polling I am aware of (actually more applicable to Nelson voters). It may be that these people identify as Liberal voters because of their stance on the forestry bill, or they may have adopted this position because it is the Liberal position and they are long-time Liberal supporters. In reality there is probably a bit of both going on. As a result, this polling suggests Mr Vincent is on the losing side of his only point of difference.

Candidate 4: Cheryl Fuller (Independent) is an active and outspoken candidate with two strikes against her. Firstly she is Deputy Mayor in her Local Council. If this sounds like a good start for a politician, I should point out that Ms Ritchie came to power in Pembroke - the lone Labor leaning candidate in a considerable Liberal history - after defeating Liberal Cathy Edwards who was also a Mayor; that Ivan Dean lost his Mayoral role after winning the seat of Launceston; and that the main campaign against Mr Wilkinson in Nelson is that sitting on the LegCo should be his full-time job - the same argument used to thwart Edwards and Dean.

Secondly, Ms Fuller is a moderate, even a centrist, describing her political stance as "somewhere in the middle" and certainly not a conservative. She will probably pick up a lot of the Left-wing vote, though, especially if Mr Morgan drops out in the first round.

Scenarios: I'm going to call Mr Morgan as the first to drop out, with most of his support flowing to Ms Fuller. The three way battle is hard to predict.

1) If Mr Vincent is leading at this point then we will probably see either:
Ms Hiscutt eliminated and (being the most right-wing of the candidates) the preferences going to centre-right candidate Mr Vincent over Ms Fuller
or
Ms Fuller eliminated with preferences going to Mr Vincent (or rather, not going to the Liberals) for a comfortable win.
Outcome: Mr Vincent elected.

2a) If Ms Fuller leads and Ms Hiscutt is eliminated, right wing preferences will flow to centre-right Mr Vincent before moderate Ms Fuller.
Outcome: Mr Vincent elected.

2b) If Ms Fuller leads and Mr Vincent is eliminated, preferences may flow to Ms Hiscutt with similar policies, or away from the far right and towards another Independent (Ms Fuller)(it seems Tasmanians like Independents in their independent house of review...)

Assuming a roughly even split, Ms Fuller would maintain her lead. In reality a pro-Hiscutt skew would be expected.
Outcome: Tossup.

3) If Ms Hiscutt leads, it is probably at the expense of Mr Vincent. Vincent voters would split preferences as above: perhaps 50-50, but probably towards Hiscutt.
Outcome: Ms Hiscutt elected.

Of these, the general feeling I'm getting is Scenario 3 as the most likely. However, while I will predict Ms Hiscutt elected as a best guess, I am not prepared to stake anything on this.

Prediction: Tossup.

Conclusion:

Although the Legislative Council's low news rating means little polling and rough approximations in our predictions, I'm suggesting:

  • Jim Wilkinson will retain Nelson, and
  • Vanessa Goodwin will retain Pembroke for the Liberals

I'm also making some informal predictions, not counted in my record tallies (for the reasons mentioned in parentheses):
  • Leonie Hiscutt to win Montgomery for the Liberals (tentative)
  • Cheryl Fuller to place second in Montgomery (tentative, prediction has no practical value)
  • Kevin Morgan to place last in Montgomery (prediction has no practical value)
  • Allison Ritchie to place second in Pembroke (prediction has no practical value)
  • Tom Baxter to place second in Nelson (prediction has no practical value)

While it may seem a little cheap, and even pointless to call the perhaps obvious seats of Nelson and Pembroke while shying away from the tough case of Montgomery, there really isn't enough data to judge this case and I have been burnt too many times by my hesitation to use the 'tossup' category. However, I have still made my best guess, which is all you would have got out of me anyhow. I'm just stating that I'm not confident enough to risk reducing my success rate on it.

Check back next week for a review of these predictions!

* Queensland only has one house in its parliament
** 2-Way contest, won with 57.09% of the vote
*** 6-way contest, won from 42.87% of the primary vote

Saturday, 27 April 2013

"...except for all those other forms..."

With the honeymoon of the early election announcement over, and a long way to wait until the campaigning starts in full force, we are now well and truly in the limbo of nothing much happening. If there is nothing to write about, I won't belabour (or beliberal) the point by writing space filler, so this blog might go into kryogenic storage for a few weeks. However there are a few more things I plan to discuss first, so that won't be happening for a month or so at the bare minimum. This week, however, we'll be taking a pretty laid back, psephologically light approach after the number crunching of the last fortnight.

Some of you may have noticed that this upload did not magically appear on Friday. The reason for this is that I am now working full-time, so I'll be doing most of my writing on the weekends. I'll be aiming for Saturday evening uploads, so you can peruse my latest posts on lazy Sunday mornings, as you recline in your suave smoking jackets and muse distractedly over your coffee and a crossword or two.


This. This is my new target audience.
Unfortunately, on occasion, delays may mean a Sunday morning update. Or, on certain particular occasions - e.g. next week - I may strive for a Friday upload. But, as women and men of leisure I hope this will not overly inconvenience you. If you want, you can check in after your Sunday post-lunch polo match to ensure there is a new upload. Or you can just ask your valet to keep checking for updates.

This post's title is taken from Winston Churchill's famous speech after being voted out of office: "Democracy is the worst form of government, except for all those other forms that have been tried from time to time."

I do not automatically agree with the more common paraphrasing of this quote: "Democracy is the worst form of government, except for all the others." I am not convinced that democracy is the best possible system of rule, or even that it is necessarily the best system proposed so far. I will, however, agree with the words of Winnie; there has not been a better system of government successfully imposed in recorded history, if we judge it on its ideals, its practicality, its treatment of the people and its shortcomings.

Australian democracy is, I feel, the worst example of democracy, "except for all those other forms that have been tried from time to time." I do not believe it is perfect, I do not believe it is the best possible form of democracy, and I do not believe it is even the best proposed form of democracy. I have spent the last two weeks criticising compulsory voting and suggesting alternative theoretical electoral systems. But we are very lucky to have such a robust, reliable and something-else-beginning-with-r system, so this week I am going to look at what is so good about Australian elections, and applaud the AEC for the fantastic work it does.


Those Who Cannot Remember the Past are Condemned to Repeat HIST1001:


ATHENS: Everyone should be well aware that democracy started in Ancient Greece. The Athenian system was simple. The Legislative Assembly (which passed the laws) was composed of all eligible citizens. There were also "elected" officials. And by "elected", I mostly mean "selected by lottery".


Old School Responsible Government

It is fun to imagine the election officials of Ancient Greece as elderly women in bingo halls. There were systems in place to attempt to limit incompetence (e.g. most positions were part of larger councils, and positions could not be held more than once (or twice in the case of boule)). Only 10% of officials - mostly those in charge of finance and military - were elected in the sense we recognise today.

The short comings of this form of democracy are obvious - even if you happen to fluke an entirely competent government, you could have corrupt, fanatical or extremist officials enforcing (or not enforcing) the law. Also, every eligible citizen needs to organise, understand and pass the laws of the land. And eligible citizens did not include women, slaves, people under 20 years of age, foreigners or anyone without land.

SPARTA: Less well known is that the mortal enemies of the Athenians were also democratic. Their voting system was a range voting system, the same basic idea that I proposed here. Range voting lets you voice your support qualitatively. You can offer a little support or a lot of support for each candidate (or, in my system, negative support) so that the voices of those who actually care drown out those who don't.


Athenians, including apparently Aristotle, considered this to be vulgar, barbaric and childish. Mostly because instead of using ballots (as I proposed) or pebbles (like the Athenians (the Greek word for pebble - psephos - is the origin of the term psephology)) winners were determined by how loudly the audience shouted for them. The loud-guy-behind-you-on-the-bus must have been an important demographic in Sparta.

ROME: Once the Greek city states had killed each other off, then been killed of by foreigners, then finally conquered by the Roman Empire, democracy really began to spread. The Roman Senate was the start of representative democracy, where people voted for rulers rather than the laws themselves. This freed many people up for other important duties including capturing foreign slaves, masacering foreigners, and watching foreign slaves being massacred for sport. The Romans perfected many of the basics of modern democracy, including corruption, gerrymandering, concentrating power in the hands of the wealthy and overthrowing the system to become supreme ruler.

POST-ROME: The fall of Rome ushered in the Dark Ages, which were very politically complex. By the middle ages, much of the world was ruled once more by tyrants, monarchs and the church. There were some exceptions, however. In many cases this was only democratic in the sense of a few high-ranked warlords being beaten into submission and accepting (rather than electing) a ruler. Later - for example in the Italian republics or Papal elections - politics continued under the guise of democracy, although even a cursory glance at the history of these states will reveal corruption on a level that would make Old Rome blush. Think of the Medici, or the Borgia. Less is known of the Slavic Veches, but these were also be dominated by the rich and powerful.

BENGAL: A group of Bengalese rulers did democratically (and by all accounts voluntarily) elect a King in 750 AD, but as a King he was succeeded by his son and the following Pala dynesty. As such, it's not really a democracy.

VIKINGS: When not busy pillaging, the Vikings practiced a form of democracy. Viking councils elected chieftains and passed laws. One of the major draw backs was that there was no separation of powers - the councils created the laws and judged criminals. This law was them memorised and recited as needed by a particular individual, which allowed rampant corruption and gave little hope for impartiality. On the upside, these councils were called "things", which makes the wikipedia page a gem:
It is known from North-Germanic cultures that the balancing institution was the thing...
...the local things were represented at the higher-level thing...
At the thing, disputes were solved and political decisions were made.
The thing met at regular intervals...
the king realized that he was powerless against the thing and gave in. 

JAPAN: There are reports that the city of Sakai in Japan also had glimmers of democratic elections among its ruling merchant class, but was still subject to the feudal lords that ruled Japan. These elections appear to have been conducted by the elite for the elite, and although I have found very little documentation on the subject it seems likely that this was not entirely dissimilar to the type of democracy practised in the Italian Republics.

BRITAIN: Britain had a form of democratic government which arguably dated back to the Magna Carta. This was a long, slow transition from an absolute monarchy to a democratic constitutional monarchy that continues to evolve today. British elections, like many other current elections are First Past the Post (FPTP), unlike Australia's preferential system. Imagine, if you will, a four party race for a single seat, as we showed at the start of the month.

Remember this graphic?

Now, if you will recall, the defining issue of this particular election was in relation to chicken wings. The Chicken Wing party has a controversial stance, only supported by 32% of the voters - less than a third. The rest of the parties agree on their opposition, accounting for the remaining 68%. In FPTP the Chicken Wing party wins. In other words, one unpopular party can win because several other popular parties dilute the opposing vote.

In these kings of systems, it is often said that a vote for a minor party is a wasted vote. This means you are better off voting for the lesser of two (or three) evils among the main contenders, rather than voting for the party you support the most. Another common sentiment is that if you didn't vote for the second-place contestant, you effectively voted for the winner since all you really did was deprive the second-placer of a much needed vote.

USA: Much of the American elections suffer from a similar problem. In the Bush-Gore presidential election (2000) Gore lost several important seats by a small margin, and exit polls suggest that many of those who voted for a third option - Mr Nader - would have tipped the election in Gore's favour in a preferential system. Mr Nader drew off a few Democratic supporters that would otherwise have preferred Gore, which means the presence of a left-wing candidate may have won the election for the right-wing Republicans.

Bush won in 2000 by five electoral college votes. This means that if three of those votes switched hands, Gore would have won. 49 of the states (not counting Montana or Maine but counting Washington D.C. as a defacto state) are won in a block, and the number of electoral college votes for each state are the number of senators for that state plus the number of representatives the house of representatives. Since each state has two senators and at least one house representative, every state is guaranteed three electoral college votes. This means if any state other than Montana and Maine was skewed by Mr Nader syphoning of voters from Gore then Gore could have won in 2000 and Geroge W. Bush may never have been the President of America.

This is the pro-choice, gay-rights supporting environmentalist that gave the world George W. Bush

Beneath our Radiant Southern Cross:

With exhaustive preferential voting and compulsory attendance, I'm pretty happy with the Australian political system really. I'm not to thrilled by the way people are coerced into voting when they don't care (giving the illusion of compulsory voting) but I quite like compulsory attendance. It means everyone definitely had the opportunity to cast a vote. I just think there should be an official, formalised way to declare that they do not wish their vote to be counted, rather than the skullduggery of informal voting. 

Given how much time and effort the AEC puts into ensuring people remember how to cast a valid vote each year, I wonder how many people know the system well enough to actually consider casting an invalid vote on purpose.

At this point I would like to repeat my admiration for the excellent work the AEC does. Around the country they will arrange and construct great numbers of booths out of rigid card; print and distribute electoral rolls; manufacture the randomised upper and lower house ballots and send them to the correct seats AND to any polling places where voters will be when away from home; count, and supervise the counting, of votes including postal, early and overseas votes; checking each form to determine if it is invalid and that no one forgot to include the number 37 on the white ballot when voting below the line; distributing and redistributing and reredistributing preferences (remember that some upper house ballots have over 50 names!); collating and announcing the results and packing up again afterwards.

And that is just the federal elections. The AEC will also run elections right down to workplace-level union votes and, if you were willing to pay, would probably even do a school's S.R.C. elections! And it has a top-notch education programme as well. (e.g.)

To compare, the US presidential election last year had voting machines that would not let you vote for certain candidates, people from one state could not vote if they were travelling, voting booths were divided by curtains that could be subtly drawn aside and the counting was chaotic.

THANK YOU AEC!

Next Week:

Next week I will be striving to get a post up by Friday, despite what I said about your regular update time being moved to Saturdays. Why? Tasmanian Legislative Council elections of Saturday, dear friends. Predictions to follow!

Friday, 19 April 2013

More Donkeying Around

The last time I did a two-part post it was to provide details of the maths relating to my Variable-Dependent Transparency Arrays, and in between the news of the papal election broke and I had to wait an extra week to get my more topical post out.

This week I'm out in the field, so I couldn't provide a more topical post if I tried. And again, the need for a two-parter was caused by the desire not to overload you with maths that, I assure you, makes perfect sense in my head. Most of the maths this time is pretty basic, relying mostly on ratios, averages and differences but it is always ten times harder to explain in words than it is to actually do the maths.


The Story So Far:


So, we have been looking for a method to determined the prevalence of Donkey Voting, that statistically irritating practice of voting 1, 2, 3, 4 from top to bottom regardless of candidate order. The problem, of course, has been isolating these votes from those of people who voted 1, 2, 3, 4 from top to bottom as the result of reasoned decision-making.

Purely looking at the portion of votes received by first-place candidates is obviously going to overlook some major factors such as the fact that certain major parties regularly receive more votes than other minor ones.

It turns out that comparing their proportion of the vote in a given division against their parties national average is highly unreliable, giving an average of 3.05 and a standard deviation (σ) of 12.04 among parties that led the ballot, and compared to an average of 4.06 for all candidates and a σ of 11.86. In both cases the σ value is several times greater than the mean, and using the 68-95-99.7 rule we can expect a spread greater than ± 30. Given the mean is only around 5% of the range, we may as well call it 0 ± 30.

Some of the main factors affecting this calculation are that candidates will perform much better given fewer opposiing candidates, and will collect a larger portion of the vote when there is no other party competing for their support base (i.e. they are the only left-wing or right-wing party). It is also important to realise that, with the exception of the ALP and Greens, no party contested every seat and thus had a national primary vote undermined by at least a few seats where they received 0% of the vote.

Early results using only the 2010 federal election data suggest more reliable results can be obtained by looking at each parties overall average swing and comparing the average swing it received in seats where it lead the ballot. Further examination against other elections is needed, but it seems that first-place candidates regularly receive a notably greater swing than second-place or last-place candidates on this scale.

Because the swing compares each candidate's result against their performance (or, if a party has changed candidate, their predecessor's performance) in the previous election, it is not affected by the first two distorting factors mentioned for the previous method, assuming that the seat maintains a similar number of candidates belonging to similar parties. The greater the difference from election to election, the less reliable this method is likely to be. This method is not affected by parties who do not contest certain seats, either.


The Good, The Bad and The Intricate:


So far there has been one method that just plain does not work, and one that might. Here is a third, more complex method.

If a donkey voter ranks the candidates from top to bottom, and the first candidate is eliminated, their vote will pass to the second candidate. If we can determine the normal flow of preferences from one candidate to the others, we can see how many more votes than normal flow on to candidate two.

For example our great and glorious leader, Antony Green, proposed as rough guide for predicting preference flows in the WA state elections that 70% of Greens votes flow to Labor on a two-party preferred basis, and 75% Nationals votes flow to the Liberals.

If we find the average proportion of, say, Greens votes that flow to Labor and the Liberals then we could predict how the preferences would flow in a three candidate race between them if the Greens candidate dropped out first. Lets use Antony's 70% figure for this example.

In most cases 70% of Greens preferences flow to the ALP. In a case where the Greens candidate lead the ballot and the Liberals were placed second, however, lets say 35% of the vote passed to the Liberals. This is 5% greater than expected, and we could propose that 5% of Greens supporters in that seat donkey voted as an explanation for this deviation from the average. (Note that only Greens voters can be donkey voters in this example, since our definition of a donkey vote requires them to place a 1 next to the top (i.e. Greens) candidate.)

If 20% of voters voted for the greens, and 5% of these are donkey voters, then 1% of voters in that seat are donkey voters.

This method is very rough and that 5% variation could be the result of atypical political ideas in the voting public of that seat or the result of some division-specific factor. However, on a large scale this may yield an average figure for donkey voters as a proportion of the voting community.

Of course, determining the average flow of preferences is the hard part. If I had access to the ballots themselves - or for example if the AEC produced for each division a table listing the number of people who voted 123, the number voting 132 and do forth - then this would be quite simple. Instead we will have to try and calculate this another way.

One simple approach is to focus entirely on districts during the first redistribution of votes, and take an average of the portion of votes directed to each other party. In 2010, across all the seats in which Australia First was eliminated in round 1 and the Liberals also contested the seat, an average 13.94% of Australia First's vote passed to the Liberals.


The Carers Alliance and Communists both lost a single division on the first redistribution, so the figures in red are not really an average but a single result.

Note that these figures rarely add up to 100%, because parties contest different seats. To explain this, imagine Parties A, B and C contest a seat and that Party A is the first to drop out. Party A's votes are then distributed 70% to the like minded B party and 30% to the C party.

This is the only seat that A and B both contested which A lost in the first round, however there is another seat contested by A, C and D which A came lowest in as well. The votes of A are split 50-50 between Parties C and D. Thus A's votes are split with 70% going to B, 50% to D and an average of 40% to C, adding up to 160%. Now, it is easy to correct this so that the rows do sum to 100% simply be dividing by the original total then multiplying by 100 thus:


However, this overlooks a key point:
The proportions of a vote that passes on to another party relies upon which other parties are contesting the seat. Thus 30% of the A votes flow to C if B also contests the election, and 50% if it doesn't. In other words we need to compare apples with apples again, and only compare seats contested by an identical set of parties.
As we saw last week, there are very few cases where divisions are contested by candidates from the exact same set of parties. The most common case is the divisions contested by the ALP, Liberals and Greens only - and even then this amounts to only six divisions. To take an average of vote redistributions from seats where the parties contesting are directly comparable (and thus must also contain no independents) is not going to yield reliable results over a single election given the small sample sizes.
Instead, if I want to look at the preference flows of Party A to parties B, C and D, I take the average flows of all seats lost by A in the first round of which B, C and D are a subset of the contesting candidates. I would therefore look at the flows in seats contested by {A, B, C, D, E}, {A, B, C, D, F} and {A, B, C, D, G, H} as well. This is a less refined approach but will hopefully iron out any outliers far better.

This will all be much clearer once we get down to actual cases. There are 20 seats where the first party eliminated was at the top of the ballot (Aston, Bonner, Bradfield, Dawson, Dobell, Dunkley, Fowler, Gippsland, Gorton, Kingston, Lingiari, Lyons, Mackellar, McPherson, Menzies, Mitchell, Moore, Rankin, Scullin and Werriwa). These are the ones we are interested in, since we want to know how much of their vote passed on to second place, compared to what we would normally expect.

Results:


To begin with Bradfield (NSW), the three candidates were (in order):

  1. GEMMELL, Susie (Greens)
  2. GALLARD, Sarah (ALP)
  3. FLETCHER, Paul (Liberal)
With 14,231 votes, the Greens ranked the lowest of the three and was eliminated. 10,977 of these votes flowed on to the ALP, the remaining 3,254 passing to the Liberals. This is a 77.13% flow to the ALP, while 22.87% of the votes flow to the Liberals.

In all the seats where the Greens are eliminated first and both the ALP and Liberals are present to receive a share of the votes (i.e. Canberra, Barton, Bradfield, Mackellar, Werriwa, Braddon) the average Labor flow is 75.19% and the Average Liberal flow is 22.87% (adjusted to ensure that the two equal 100% of the votes).


The flow in Bradfield is 1.94 pp higher than the average. This could be artificially boosted a little if any of those comparison seats also contained another party leaching some of the Greens flow-on vote. (As it happens they do not.)


This is equivalent to 1.94% of the 14,231 redistributed votes (which must contain all of the donkey votes), or 276 donkey votes.

Below, the same process is applied to all seats where the first-place candidate is eliminated first, except Moore. Since Moore is the only seat where One Nation was the first candidate to be eliminated and had a CDP candidate, the only comparable seat to determine the predicted flow for Moore is Moore itself. This means the actual and theoretical flows are identical, and the 'Lift' = 0 pp for all remaining candidates.

Independents have to be ignored in calculating predicted flow for obvious reasons (namely that there can be no comparable seats since only the division in question is contested by that particular independent). For this reason, Independents are not factored into the Redistribution Percent.


The seat of Lingiari has only one other comparable seat, due to the presence of the Country Liberals, a Northern Territory specific party. If we treat the Country Liberals and Liberal Party as equivalent, the results are as follows:


And yes, technically NT is a territory, not a state. Live with it.

There is only one division out of the 19 reviewed here where the first-place party performed worse than the predicted flow would suggest: Gippsland (VIC) by -1.21 percentage points.

The average 'Lift' for first-place candidates is 11.06 pp (11.98 pp if Lingiari uses broader Liberal Party data), and the average number of calculated donkey votes is 395. The average electoral division has around 82,500 voters. At around 400 donkey votes per seat, that is a donkey vote rate of 0.48%.

Final Thoughts:

When I began working on this week's method of calculating donkey votes, I was tempted to calculate a basic table of preference flows, then move on to second round eliminations. Because we would know how many votes the second eliminated party got from the first, and we would know their probable preference flows, we could determine the preference flows of the second eliminated party, and then the third, and so on to refine our averages.

I decided against this for many reasons. Firstly time. Secondly, I can see errors accumulating, so that a tiny inaccuracy from the average of first round eliminations would add to any inaccuracy in the second round and so on. Thirdly, if you really want a reliable measure of preference flows (and, for that matter, exactly how many people voted 1, 2, 3, 4) you need the original ballots.

We have seen, over the last few weeks, estimates of the donkey vote rate ranging from around 2.34% to less than half of a percent. However, over the population of several thousand voters, donkey voting can potentially make a difference, especially in a preferential voting system like ours where a single vote can determine who gets eliminated after each round, and the flow of preferences that this entails. Even at a rate of 0.48% of a percent, there were almost 60,000 donkey voters last federal election. That is big enough to form a seperate electoral district - Lingiari had less than 46,500 registered voters in 2010.

Compulsory Voting: Don't be a Donkey.